10 Important Sales Enablement Metrics They Don’t Talk About
Key Takeaways
-
Going beyond typical sales metrics provides a more detailed view of sales enablement impact and reveals unseen areas of opportunity.
-
By monitoring often-overlooked metrics, such as content engagement and buyer interaction depth, sales teams gain valuable insights that can inform their strategies and improve results.
-
Incorporating qualitative data, such as sales confidence and discretionary effort, helps capture the complete picture of sales team performance and morale.
-
Implementing new metrics calls for clear goals, cooperation with sales teams, and contemporary tools for efficient data capture and processing.
-
By tying sales enablement metrics directly to revenue growth, you can make smarter decisions and show stakeholders the impact of your enablement work.
-
Coupling quantitative metrics with human insights ensures a healthy balance, promoting a data-driven but people-centric sales culture.
Sales enablement metrics are figures that demonstrate the effectiveness of sales tools, training, and content in assisting teams in securing deals.
These metrics monitor things such as content usage, sales cycle length, win rates, and team skills. Teams utilize them to identify voids, enhance productivity, and meet objectives.
Clear metrics help leaders make good calls and set smart goals. To demonstrate how these fit into daily work, the following sections decompose key varieties and how to employ them.
Let’s dive in.
Beyond The Obvious Metrics
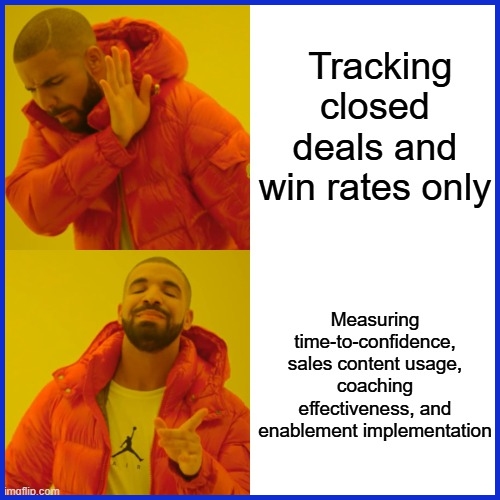
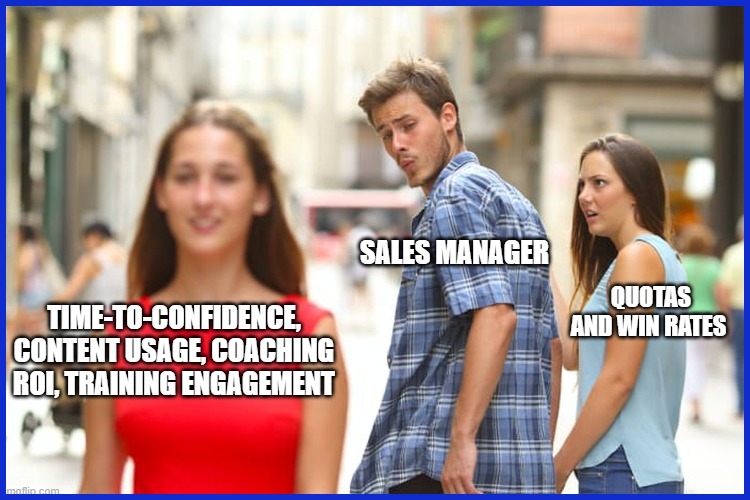
Obvious sales figures like quotas and win rates capture only a fraction of the narrative. Modern sales enablement requires more. It means monitoring what drives team development, learning, and outcomes. Metrics that dig beyond the surface can demonstrate how enablement tools and programs assist salespeople and the business as a whole.
Time-to-confidence is a good beginning. Rather than just tallying deals closed, measure how quickly new reps are comfortable pitching. Confidence can make or break a sale, and tracking this provides insight into training effectiveness. A few teams have surveys or short check-ins to get a sense of confidence after onboarding or product updates.
For instance, if a new rep hits full confidence in 4 weeks versus 8, that demonstrates the enablement program works.
Sales content usage is yet another metric that often escapes attention. It is not sufficient to produce guides, decks, or case studies. Monitor how frequently reps deploy these materials and in what context. If a product one-pager gets shared 50 times, but almost never leads to follow-up calls, it may not be buyer-centric.
Meanwhile, something like a battle-tested demo script that reduces call times or increases conversions is an obvious win.
Coaching effectiveness requires more attention. Rather than simply recording time in coaching, examine what’s different afterwards. Are conversion rates going up? Are sales cycles shortening? Personalized coaching, measured by key performance indicators such as stage-by-stage conversion, provides immediate feedback on what’s effective.
It can display which sales reps sharpen their skills after coaching and which topics yield the most effective results.
Inputs and outputs count, but so does engagement and audience. Tracking how many team members participate in enablement and how many implement the training can highlight gaps or wins. For instance, if 80% of reps attend a training but just 40% use the new capabilities, something has to change.
Balance these with guardrail metrics to avoid abuse, like monitoring not only how many calls you make, but the quality and business relevance of those calls.
Lastly, align enablement metrics with core business goals. Increasing deal size, increasing win rates, or increasing customer LTV ties enablement effort to genuine business growth. These should be measured more often — with thoughtful consideration of external factors such as seasonality or market swings — so teams can act quickly when needed.
If the business shifts, metrics should shift as well, always towards what you want to measure that’s most important for long-term growth.
10 Overlooked Sales Enablement Metrics
Sales enablement metrics demonstrate the effectiveness of sales strategies and where they can be improved. Teams that follow these figures employ data to repair vulnerabilities, optimize onboarding, and fortify the sales/marketing connection.
Revisiting simple and neglected metrics alike enables both agencies and SaaS teams to make shrewder decisions and maintain a healthy sales pipeline.
Here are the 10 overlooked sales enablement metrics for you to check:
1. Content Engagement Score
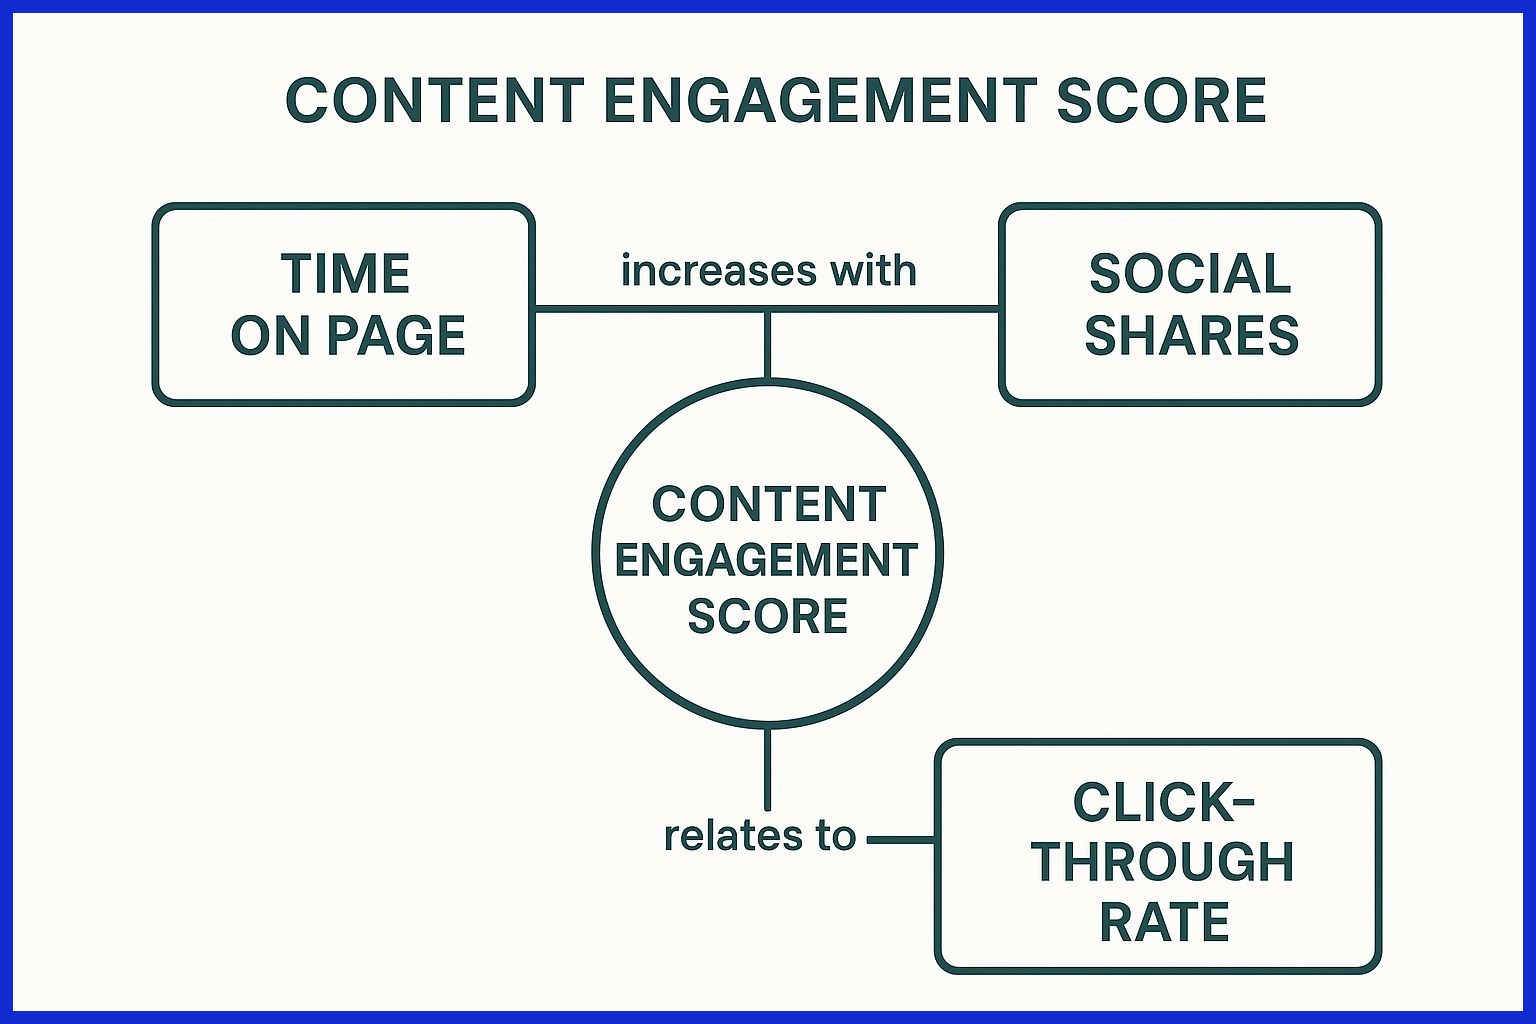
Content engagement score measures how frequently sales assets, such as playbooks and pitch decks, are used. It informs what content closes deals and what gets ignored.
Teams can leverage this score to maintain a living list of top-performing content and use feedback to repair or abandon low-scoring content for improved outcomes.
2. Buyer Engagement Depth
Monitoring how frequently buyers engage with sales content indicates who is interested. It’s not simply clicks—think time on task, questions answered, resources downloaded.
Deeper engagement tends to indicate warmer leads, allowing teams to prioritize follow-up where it matters the most. A scoring system could help turn these actions into digits.
This allows teams to associate high engagement with higher win rates and modify strategies accordingly.
3. Sales Confidence Index
The sales confidence index tracks how confident reps are about meeting their targets. Surveys can capture changes in morale and identify critical training gaps.
Trends in this metric inform coaching and assist managers in increasing team morale. Confidence is typically result-driven; therefore, monitoring the index can emphasize where additional assistance is rewarding.
4. Time to First Contribution
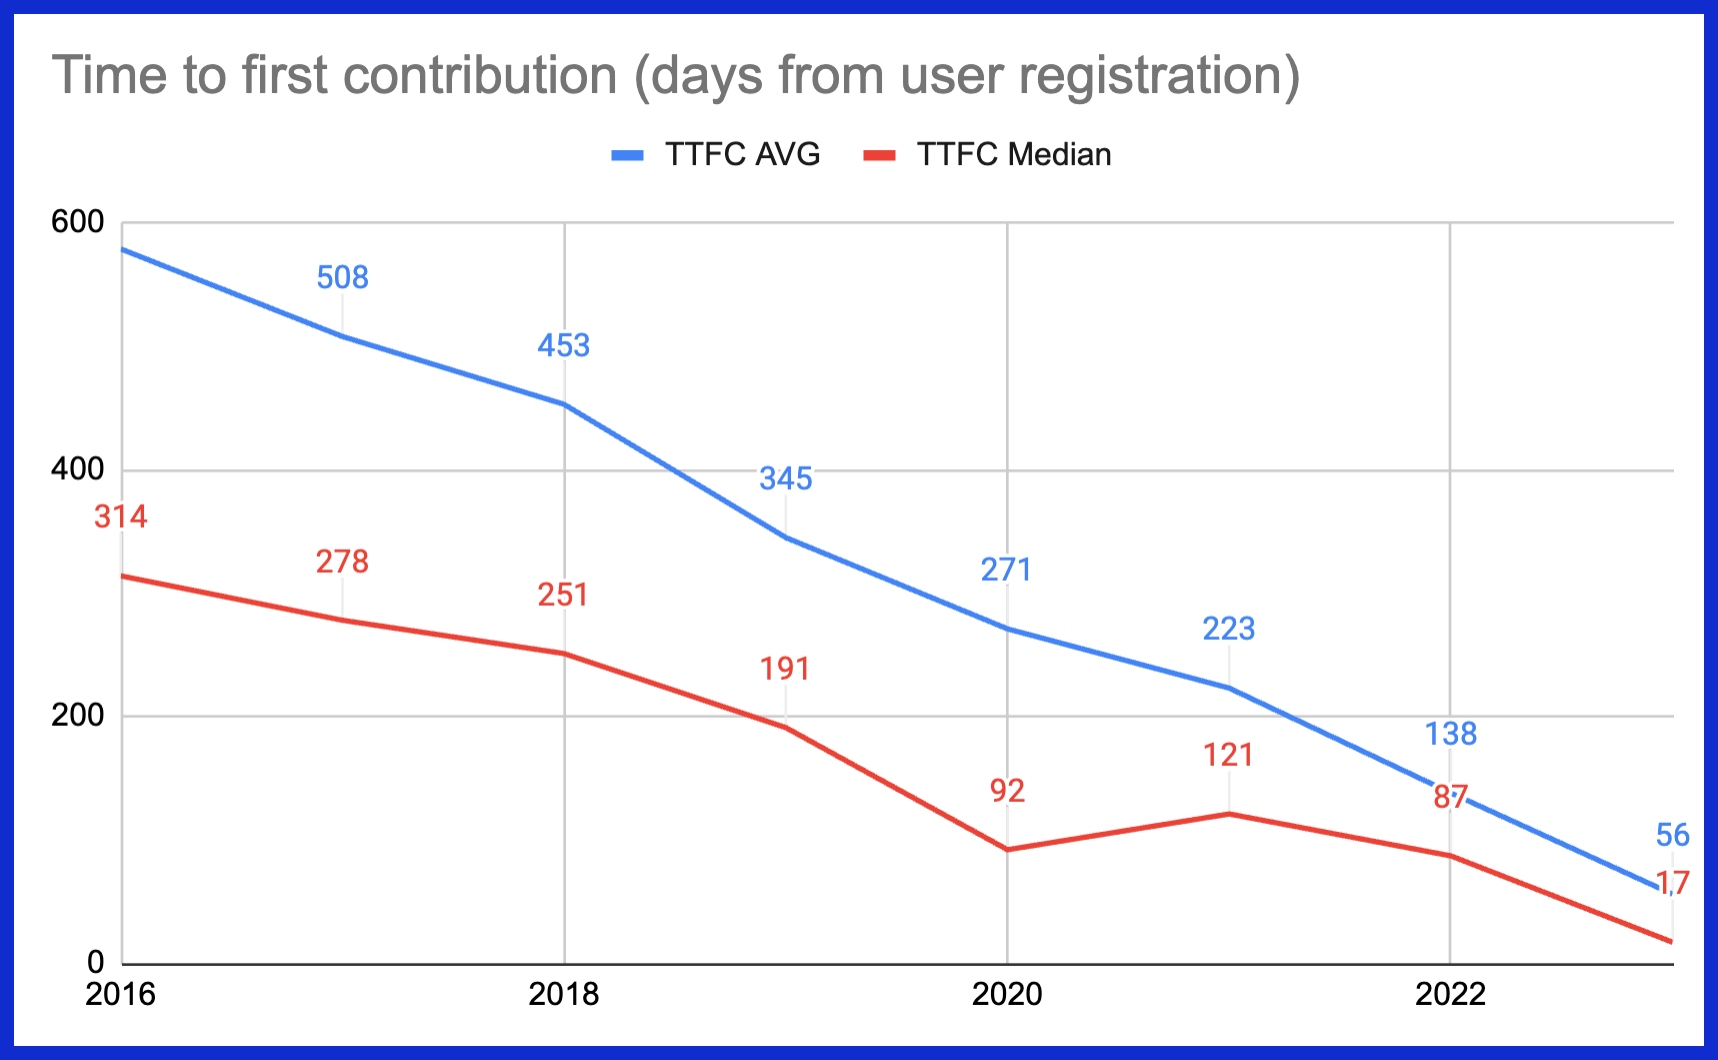
Time to first contribution monitors how quickly new salespeople secure their initial deal. Shorter times typically indicate superior onboarding.
A cross-role comparison shows what training works best. It’s a rapid way to detect if enablement gets new reps running.
This is an important metric because it can take as long as 15 months for a new hire to reach top-performer status.
5. Sales Velocity Shift
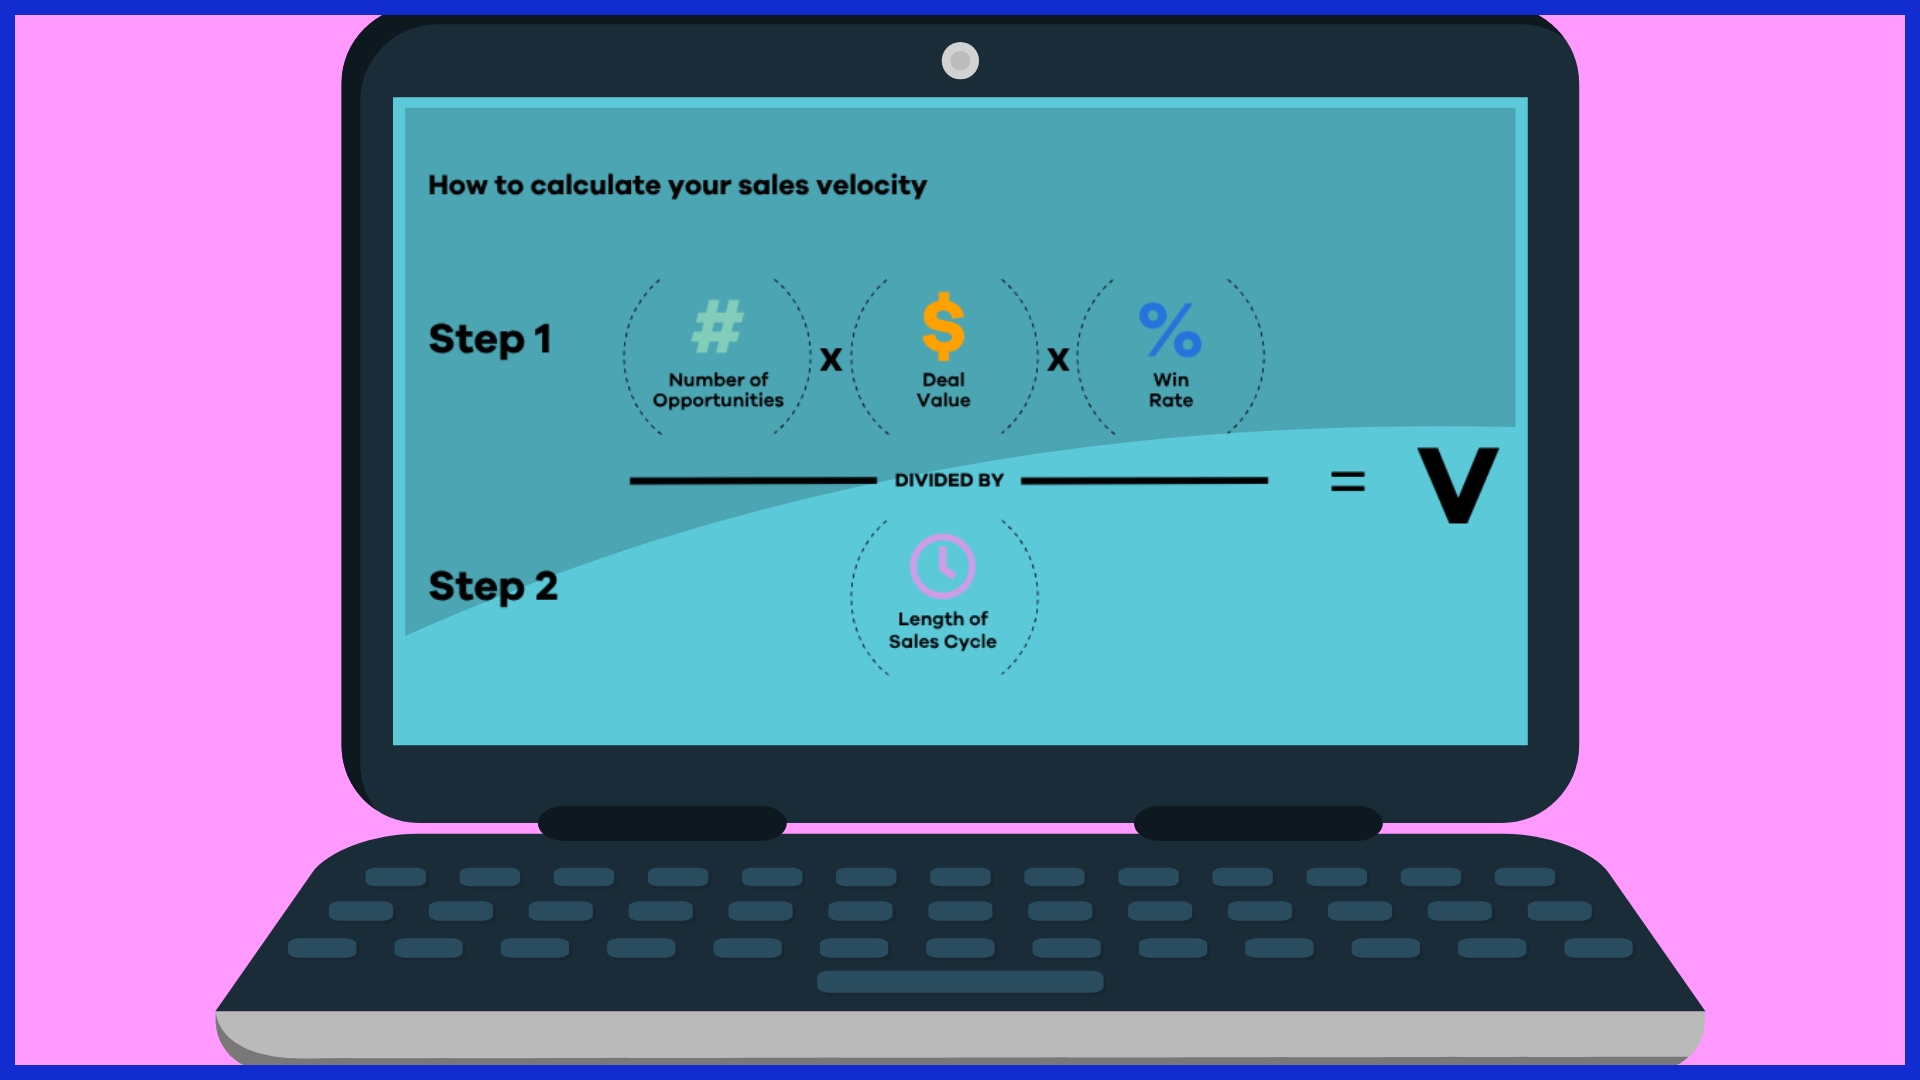
Sales velocity shift measures the speed with which deals progress through the pipeline. If velocity drags, check the process for jams.
Benchmarks allow you to compare shifts over time and determine if new enablement strategies accelerate things. A quicker cycle translates into more closed deals and stronger revenue.
6. Deal Slippage Rate
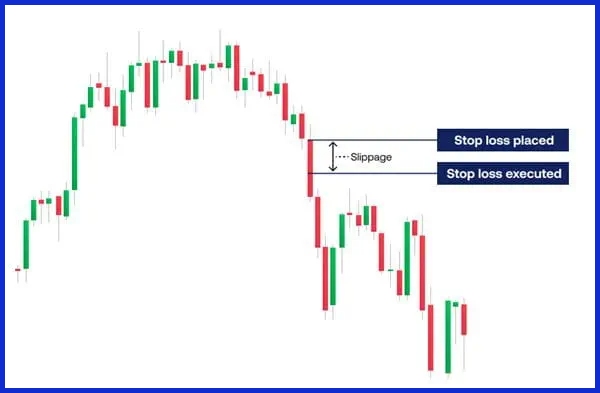
Deal slippage rate tracks the percentage of deals that slip past anticipated close dates. Elevated rates may indicate difficulty in forecasting or specific pipeline stages.
Teams can leverage this data to focus coaching, repair process breaks, and optimize resource planning.
7. Rep Discretionary Effort
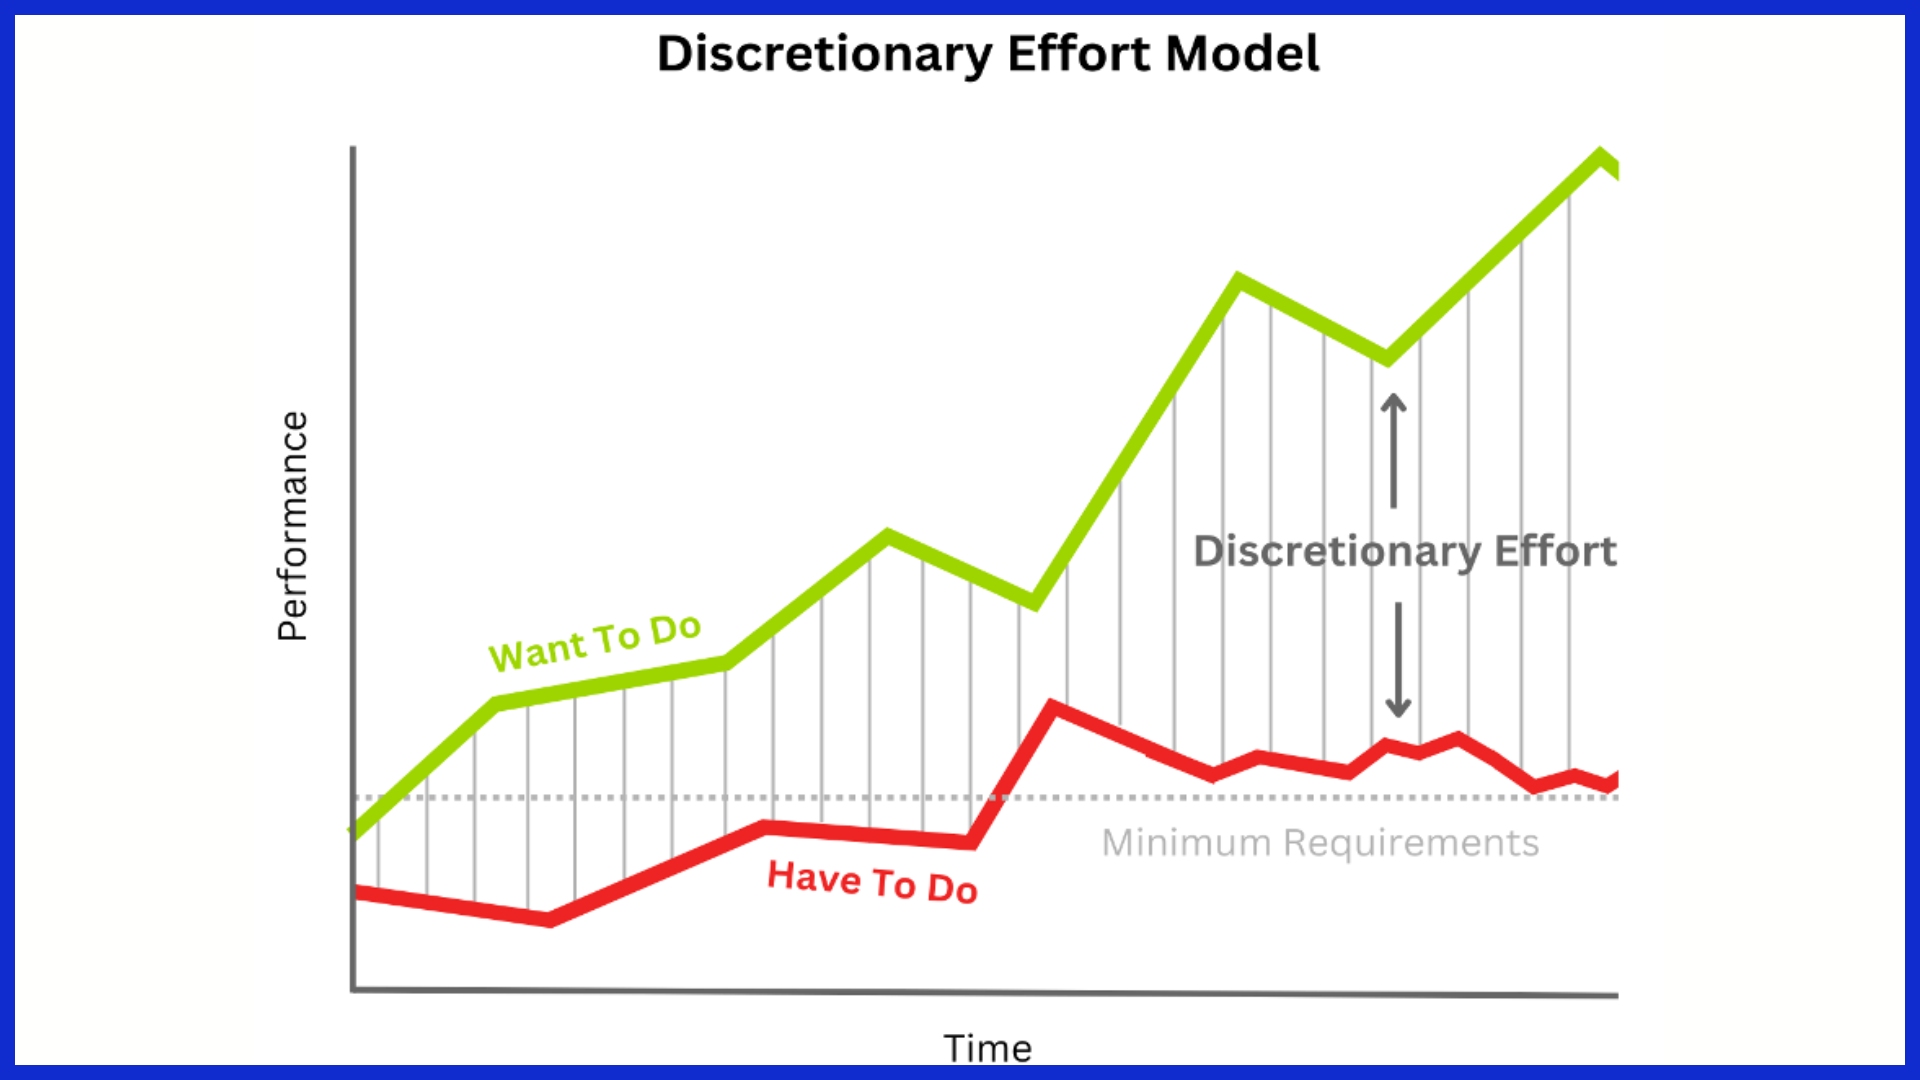
This metric examines the additional work reps perform outside of their core duties. High discretionary effort=better results, particularly among top performers.
Recognition and easy reward programs prop up this effort across the team. Effort cross-comparisons can indicate where culture or management changes are most beneficial.
8. Coaching Impact Ratio
The coaching impact ratio indicates how much sales performance improves post-coaching. Figuring this out helps demonstrate the ROI of training.
Reps’ feedback improves coaching. It’s a compelling argument for continued investments in sales training.
9. Strategic Initiative Adoption
Measuring adoption is tracking how many reps use new enablement tools or processes. Low rates can indicate a need for more training or clearer communication.
Success is measured over time, which helps us judge if strategic changes really work.
10. Customer Health Post-Sale
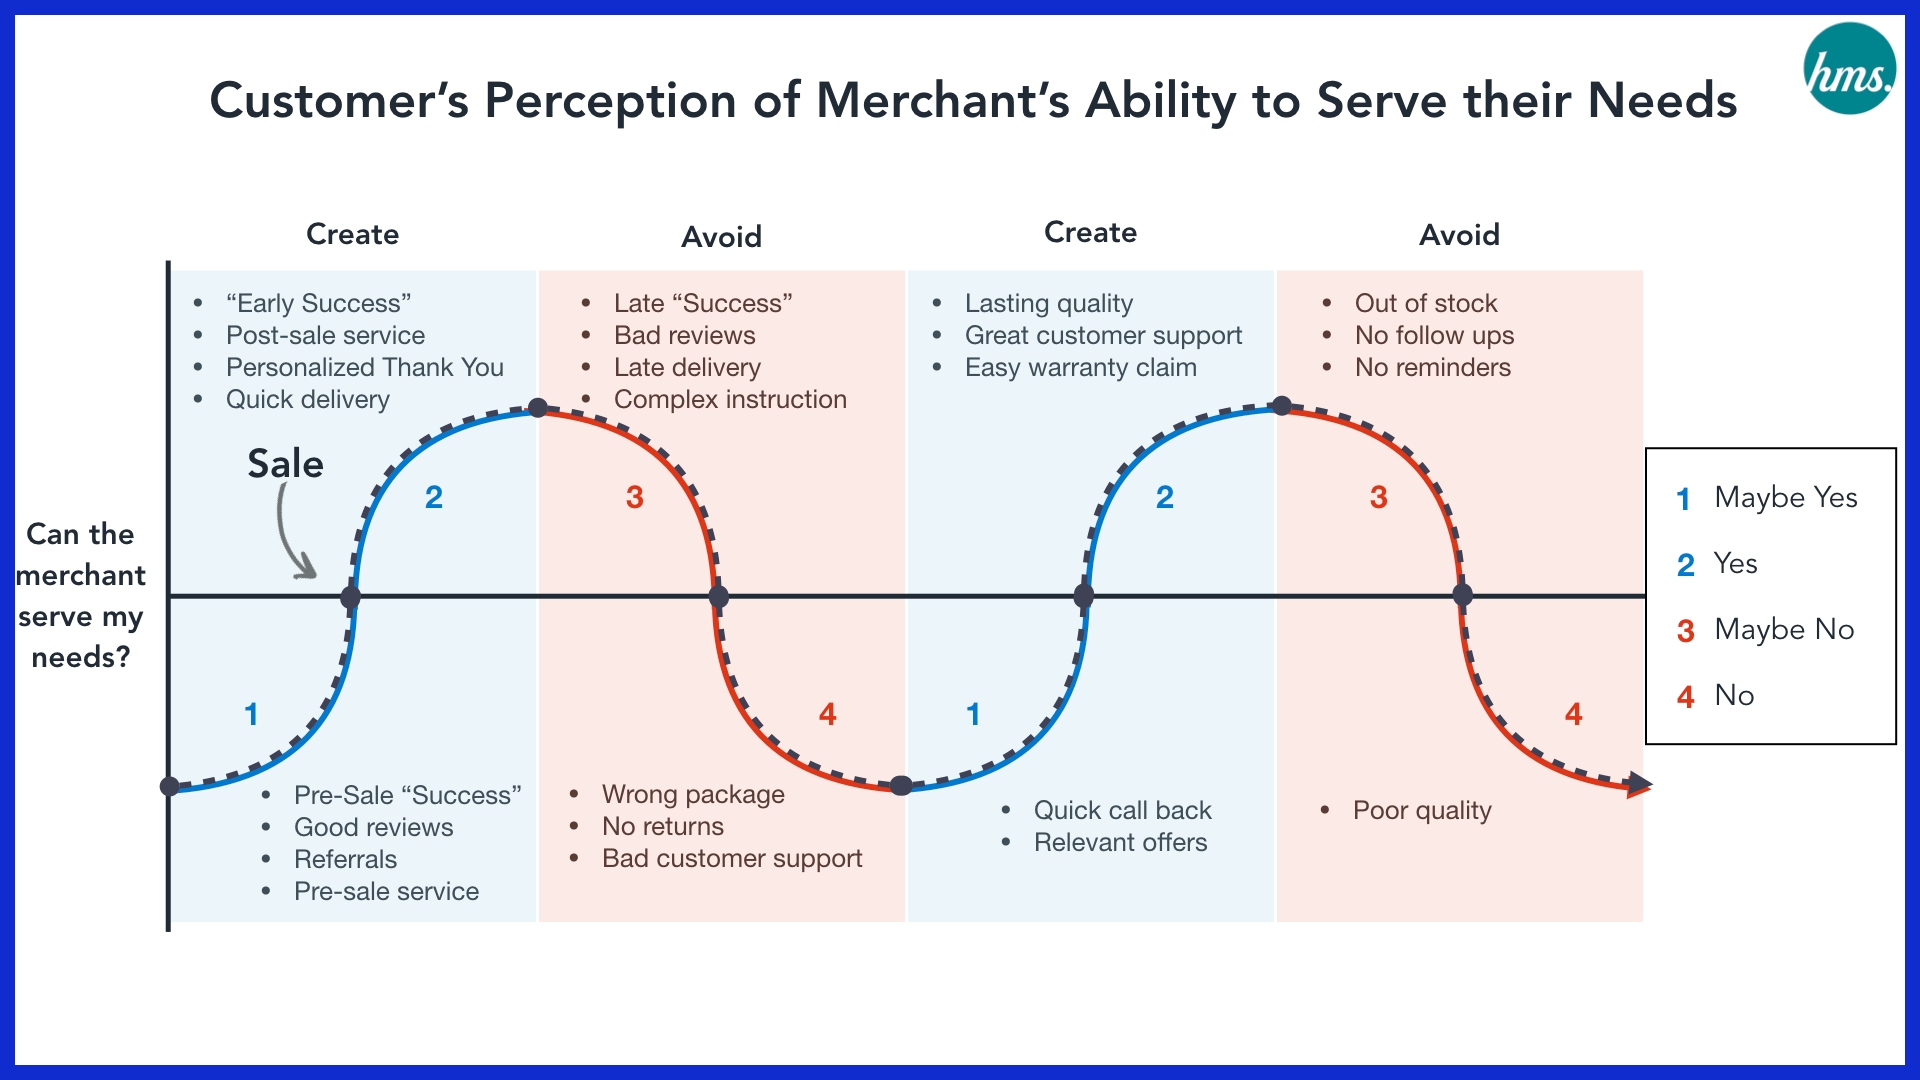
Customer post-sale health follows satisfaction and long-term engagement. Healthy customers are more likely to buy again.
These metrics assist in identifying upsell opportunities and refining sales strategies going forward deals.
|
Metric |
Significance |
How to Measure |
|---|---|---|
|
Content Engagement Score |
Shows which sales materials work |
Track views, usage, and feedback |
|
Buyer Engagement Depth |
Finds warm leads |
Count and rate buyer interactions |
|
Sales Confidence Index |
Gage’s team morale and readiness |
Regular team surveys |
|
Time to First Contribution |
Checks onboarding and ramp-up speed |
Time from hire to first sale |
|
Sales Velocity Shift |
Monitors deal with speed |
Days from prospect to close |
|
Deal Slippage Rate |
Flags process problems |
% of deals missing close dates |
|
Rep Discretionary Effort |
Links extra effort to outcomes |
Survey and observe rep activities |
|
Coaching Impact Ratio |
Assess training ROI |
Sales performance before/after coaching |
|
Strategic Initiative Adoption |
Tests enablement tool success |
Adoption rates and usage logs |
|
Customer Health Post-Sale |
Drives retention and revenue |
Customer satisfaction and engagement data |
How to Implement New Metrics
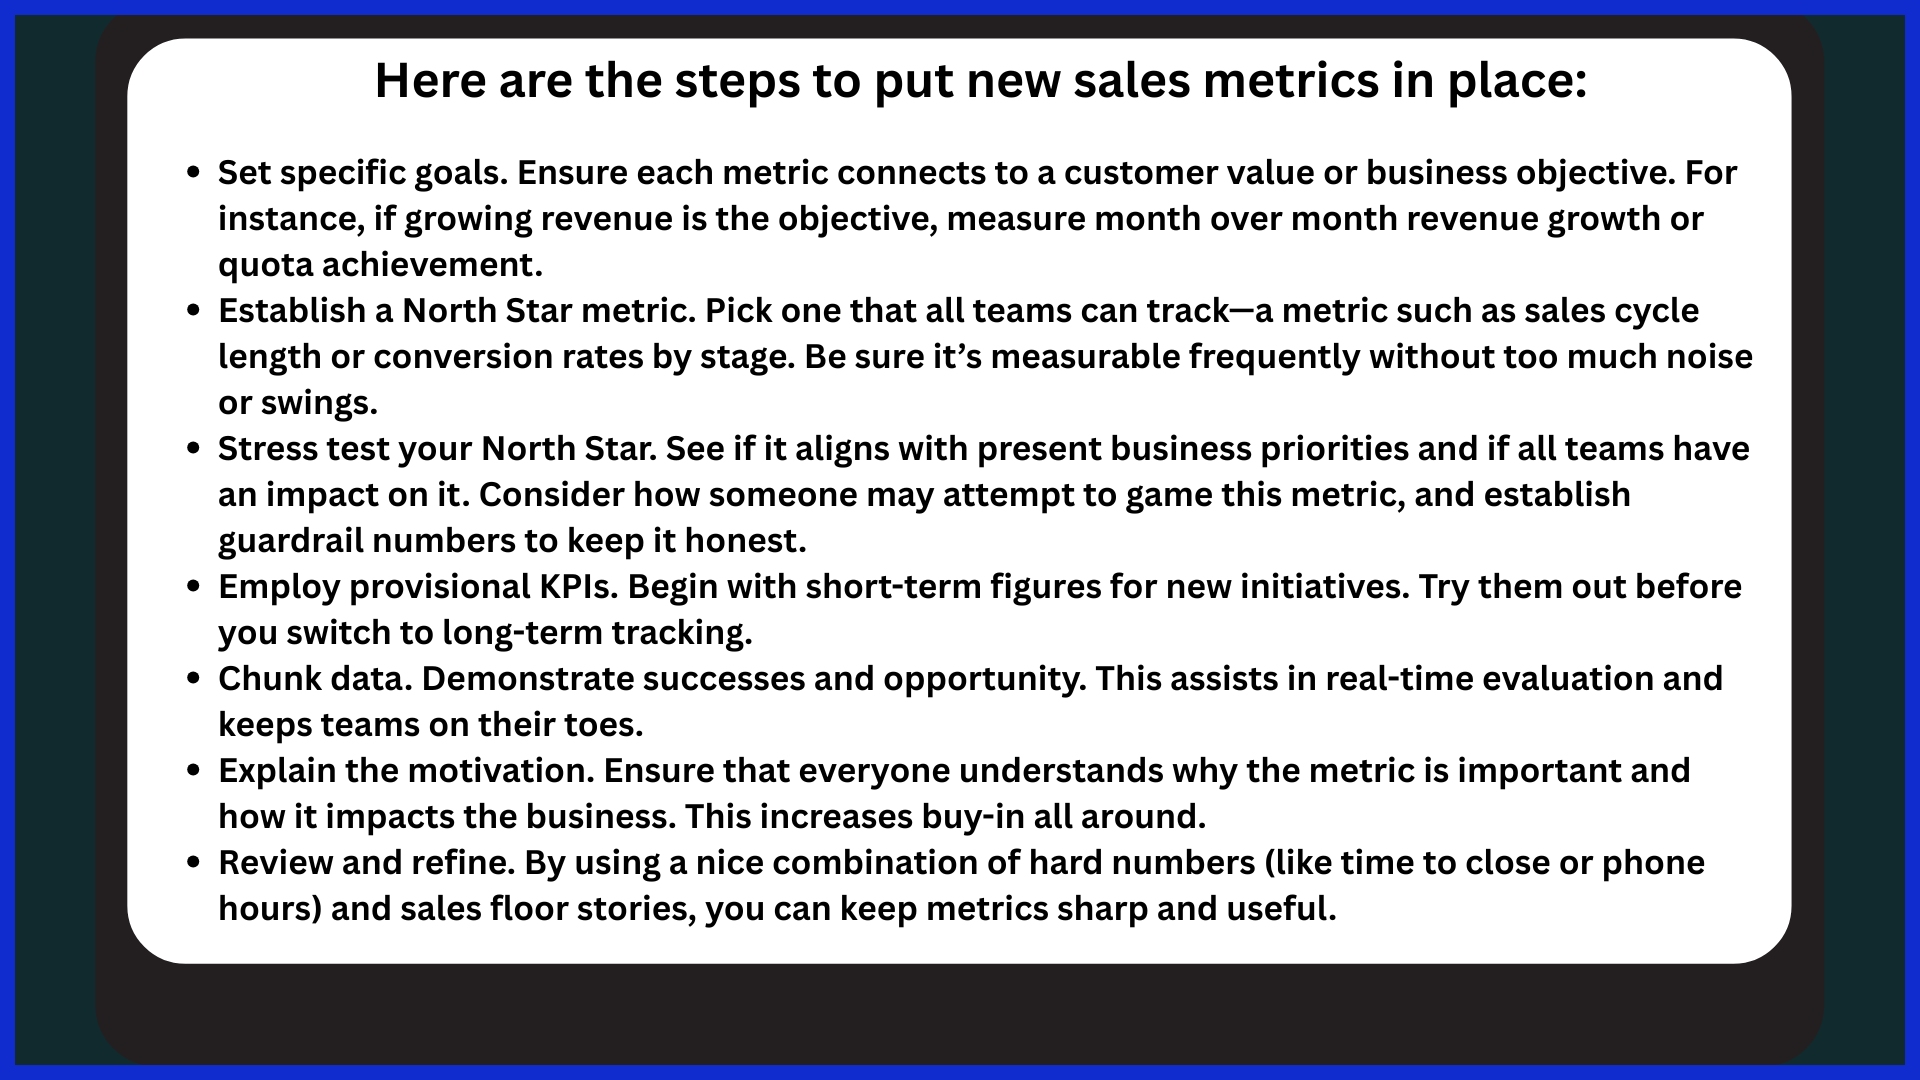
Implementing new sales enablement metrics begins with well-defined objectives. Each metric should align with what your business is about and the value you provide customers. If you crave better sales process proficiency, for example, follow stage-specific conversion rates—observe what percentage of deals advance at every step. In this way, you can identify where sales teams stall or leads fall out.
The key is to involve sales teams early. When you include reps in the metric selection process, they understand why particular figures are important and are more likely to utilize them in daily tasks. Gathering their feedback on what bogs them down, how they utilize sales enablement content, or what metrics appear to capture real momentum can enhance your overall sales strategy.
Their feedback can indicate whether a metric — such as time on the phone or rep engagement with sales content — matches the real world and not just theory. Technology assists in giving new metrics life. Sales enablement tools capture, track, and present data in easily digestible formats.
These tools can track sales enablement content usage metrics or time to close a deal. Formulas like (Content-influenced deals / Total deals) x 100 demonstrate content influence. They help you segment data, bring out the wins, and show you where things can get better.
Connecting Metrics to Revenue
Sales enablement metrics have real meaning when connected to revenue. Our teams want to see a direct connection between what they measure and their revenue. Month-to-month revenue growth is one of the simplest ways to see if changes in your behavior or strategy are paying off. When tracked, it provides a direct lens into how adjustments to sales content, rep coaching, or customer journeys impact the bottom line.
Quota attainment is another. It reveals what percentage of sales reps achieve sales goals. This is important as it indicates whether your enablement tools and training are assisting individuals in meeting goals. If quota attainment increases after you roll out new training or content, it’s a sign that the investment is paying off.
Furthermore, revenue per sales rep reveals whether the team is killing it or if a few key players are carrying the numbers. That data aids coaching and determining where to invest for improved outcomes.
Customer lifetime value (CLV) is a metric that transcends one-time transactions. It predicts how much revenue a company should anticipate from a single customer over their lifetime. Understanding CLV influences tactics in both retention and acquisition. For instance, if new annual subscribers are revealed to have a higher CLV than monthly ones, companies can direct efforts to increase the percentage of customers that subscribe annually, boosting both stability and overall revenue.
Year-over-year growth provides the wider perspective, accounting for how revenue shifts on a year-on-year basis. It assists in monitoring whether sales tactics are effective across a sustained period, not just a narrow timeframe. Sales velocity integrates critical metrics—opportunities, deal value, win rate, and sales cycle length—to provide a rapid view of the speed at which sales are generating revenue.
Sales teams can leverage this figure to identify bottlenecks or areas of opportunity to accelerate the sales process. Enablement content usage is easy to overlook, yet highly impactful. If sales reps use particular guides or pitch decks more and those reps close more deals, it’s a signal that those materials are effective.
Funnel conversion rates are important as well. When you see how many leads progress from one stage to the next, teams can identify and correct bottlenecks, resulting in more deals and more revenue.
Below is a table showing some common sales enablement metrics and their link to revenue growth:
|
Metric |
Impact on Revenue Growth |
|---|---|
|
Month-to-month revenue growth |
Shows direct progress and highlights trends |
|
Quota attainment |
Reveals training and content effectiveness |
|
Revenue per sales rep |
Informs coaching and resource allocation |
|
Customer lifetime value (CLV) |
Guides retention and acquisition strategies |
|
Year-over-year growth |
Tracks long-term revenue trajectory |
|
Sales velocity |
Measures speed and efficiency in closing deals |
|
Content usage |
Identifies what tools drive more conversions |
|
Funnel conversion rates |
Pinpoints process improvements for higher sales |
Frequent retrospectives and visual metrics assist teams in identifying effective strategies. Steering clear of vanity metrics—such as click rates that don’t connect to sales—ensures you’re focusing on figures that count. Teams that test, track, and optimize based on actual results tend to experience sustainable revenue growth.
The Human Element of Data
Even the best data needs human interpretation. Numbers show what’s happening, but people explain why. For example, two teams with the same dip in win rate might see it differently, based on morale, location, or other factors.
Teams need a safe space to talk about results, not just accept them. Sharing wins and losses helps everyone learn and grow.
Make Data Easy to Understand
Most salespeople aren’t data experts. Show them how to read dashboards, explain what metrics mean, and give real examples—like how changing a subject line improved response rates. Use visuals like simple charts or graphs to tell the story.
Personalize the Insights
When training and reports match each team’s role or region, they stick better. People remember stories more than stats—63% remember a story, while only 5% recall a single number. Combine hard data with real-life feedback to see the full picture.
A low engagement rate might look bad, but comments could show that a new audience just needs more time. That’s why data storytelling works—it connects facts, visuals, and real experiences to drive better decisions.
Balance Tech and People
In the end, data should help teams, not just look good in a report. Use it to improve performance, support people, and guide smarter choices.
Future of Enablement Measurement
Sales enablement remains fluid as new tools, new data, and new ways of working arrive. The future of enablement measurement will require a combination of definitive metrics and anecdotal feedback to align with how sales teams operate and how buyers behave.
Win rates, sales cycle length, and deal speed tracking will matter more. These assist teams to understand what’s effective and what impedes them. If a team observes their win rate decline or deals require more time, they can identify where tools or training are lacking. This type of data can reveal short-term wins and long-term deficits, so teams can target consistent growth.
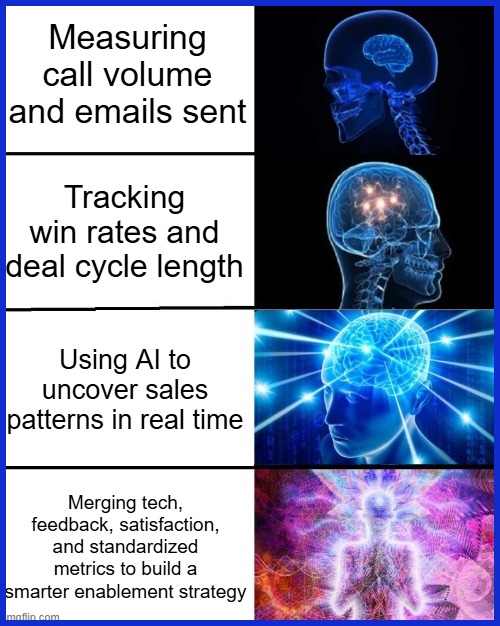
Tech will have a large role in how teams measure sales. Tools can now extract data from calls, emails, and meetings with very little effort on the part of the salespeople. AI and machine learning can wade through massive data sets quickly, extracting patterns a human would overlook.
For instance, an AI tool could identify that deals close more quickly when a specific pitch is delivered or a sales deck is sent at a particular stage. These insights can prompt change immediately, not just at the end of the quarter.
How they sell is changing, as well. Sales teams are dispersed and collaborating online more than ever. Virtual enablement tactics—such as digital playbooks, online training, or video coaching—must now be measured.
To close the loop, teams should monitor what tactics support remote reps meeting their targets, OR keep them connected. For example, measuring participation in virtual training sessions can indicate who may require additional support or a new format.
Qualitative metrics are increasing in value. Customer satisfaction and employee engagement are as important as figures. For instance, a team may have a high quota hit rate, but if the satisfaction of the customer takes a nosedive, sustainable success is in jeopardy.
Teams need to seek feedback, conduct surveys, and engage in discussions with customers and sales representatives to understand what’s effective and what requires adjustment. It will not measure in a silo.
Sales, marketing, and customer support need to share data to get a complete perspective of what’s driving sales teams to succeed. A team that connects marketing content consumption, sales rep activity, and customer outcomes will observe where holes or victories emerge throughout the funnel.
As sales enablement expands, teams require transparent standards. Standardized metrics can allow companies to understand how they compare on a global basis and identify opportunities for improvement. This simplifies the sharing of best practices, new hire training, and leader development.
Conclusion
Sales enablement metrics help teams spot what’s working and where they need to improve. Simple KPIs like time to close, lead response time, and content usage make a big difference. They show whether reps are getting the right support and resources when they need them.
Quick wins often show up in the data—faster follow-ups, better conversations, tighter playbook execution. The best teams watch these numbers closely, adjust fast, and share what works.
With tools like KPI.me, tracking these key metrics becomes easier and more intuitive. Real-time insights and clean dashboards help sales teams stay on top of performance and keep momentum going.
Want to make sure your next pitch truly lands? Start with easy-to-read metrics, track them regularly, and see how your team transforms.
Frequently Asked Questions
What are sales enablement metrics?
Sales enablement metrics, including quantitative sales enablement metrics, are statistics that gauge the impact of tools, training, and resources delivered to sales teams, helping organizations understand what drives sales performance and what they should enhance.
Why should I look beyond basic sales metrics?
Looking beyond simple sales enablement metrics reveals hidden drivers of sales success. This allows you to pinpoint where enhancements are needed, streamline resources, and more effectively empower your sales team members, resulting in higher sales and more successful customers.
What are some overlooked sales enablement metrics?
A few underappreciated metrics, such as sales enablement content usage metrics and training completion rates, provide valuable insights into sales team preparedness and highlight areas for expansion in the overall sales strategy.
How do I implement new sales enablement metrics?
Begin by matching fresh metrics to business objectives. Engage stakeholders, use trusted data sources, and review frequently. Be transparent about how and why these metrics are measured to encourage adoption and support.
How do sales enablement metrics connect to revenue?
Sales enablement metrics, particularly sales enablement content usage metrics, focus on enablement-centric areas that directly influence sales results, such as training or tool adoption. By optimizing these aspects, organizations can boost sales productivity and accelerate deal cycles.
Can data alone improve sales enablement?
Numbers alone are not enough; integrating quantitative sales enablement metrics with human insight, context, and feedback is crucial for making sense of data and driving impactful changes in overall sales strategy.
What is the future of sales enablement measurement?
The future will probably have more sophisticated analytics, automation, and integration with other business systems, enhancing sales enablement efforts. Organizations will use real-time data and AI-driven insights to perpetually optimize their sales enablement strategy.