SaaS Finance Metrics Glossary
Key Takeaways
-
SaaS finance depends on recurring revenue, deferred revenue, and customer lifetime metrics, which makes finance, planning, and cash flow very different than traditional businesses.
-
You should monitor the right SAAS finance metrics for growth and profitability, including monthly recurring revenue, customer acquisition cost, and customer lifetime value.
-
Forward-looking metrics such as net revenue retention, CAC payback period, and the Magic Number deliver crucial insight into customer stickiness, acquisition efficiency, and growth effectiveness.
-
Operational health indicators like gross margin, burn rate, and the Rule of 40 aid SaaS companies in evaluating financial stability and inform resource allocation.
-
These metrics balance growth and efficiency, which keeps your business healthy and supports future forecasting decisions.
-
Sidestepping financial missteps involves regularly tracking key financial metrics and equally prioritizing growth and profitability for sustained success.
SaaS finance metrics are metrics that help SaaS companies monitor cash, customer value, and growth. Important metrics are monthly recurring revenue, churn rate, customer acquisition cost, and customer lifetime value.
These figures provide teams and leaders with valuable insight into how the business is performing. Just knowing and checking these metrics frequently helps inform intelligent decisions for sustainable growth and profitability.
The following sections detail these fundamental metrics you need to know.
Why SaaS Finance Differs
SaaS finance differs from traditional models due to recurring revenue, varying cash flow timing, and specific key metrics that need tracking for growth and sustainability. Subscription, deferred income, and customer engagement metrics all influence how SaaS companies plan, measure, and report their financial performance.
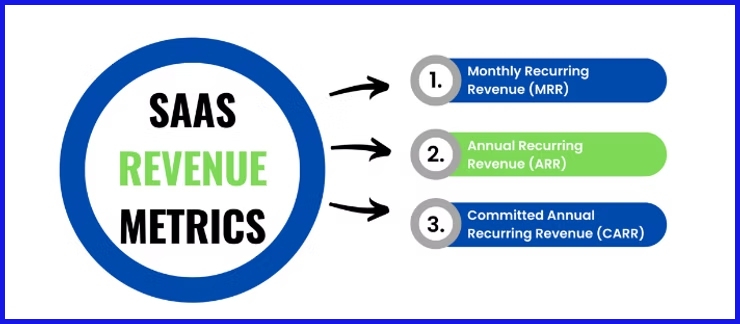
Recurring Revenue
Recurring revenue is income earned at predictable intervals, most commonly in the form of subscriptions. It’s the backbone of SaaS finance because it allows teams to forecast revenue with greater accuracy and plan with conviction.
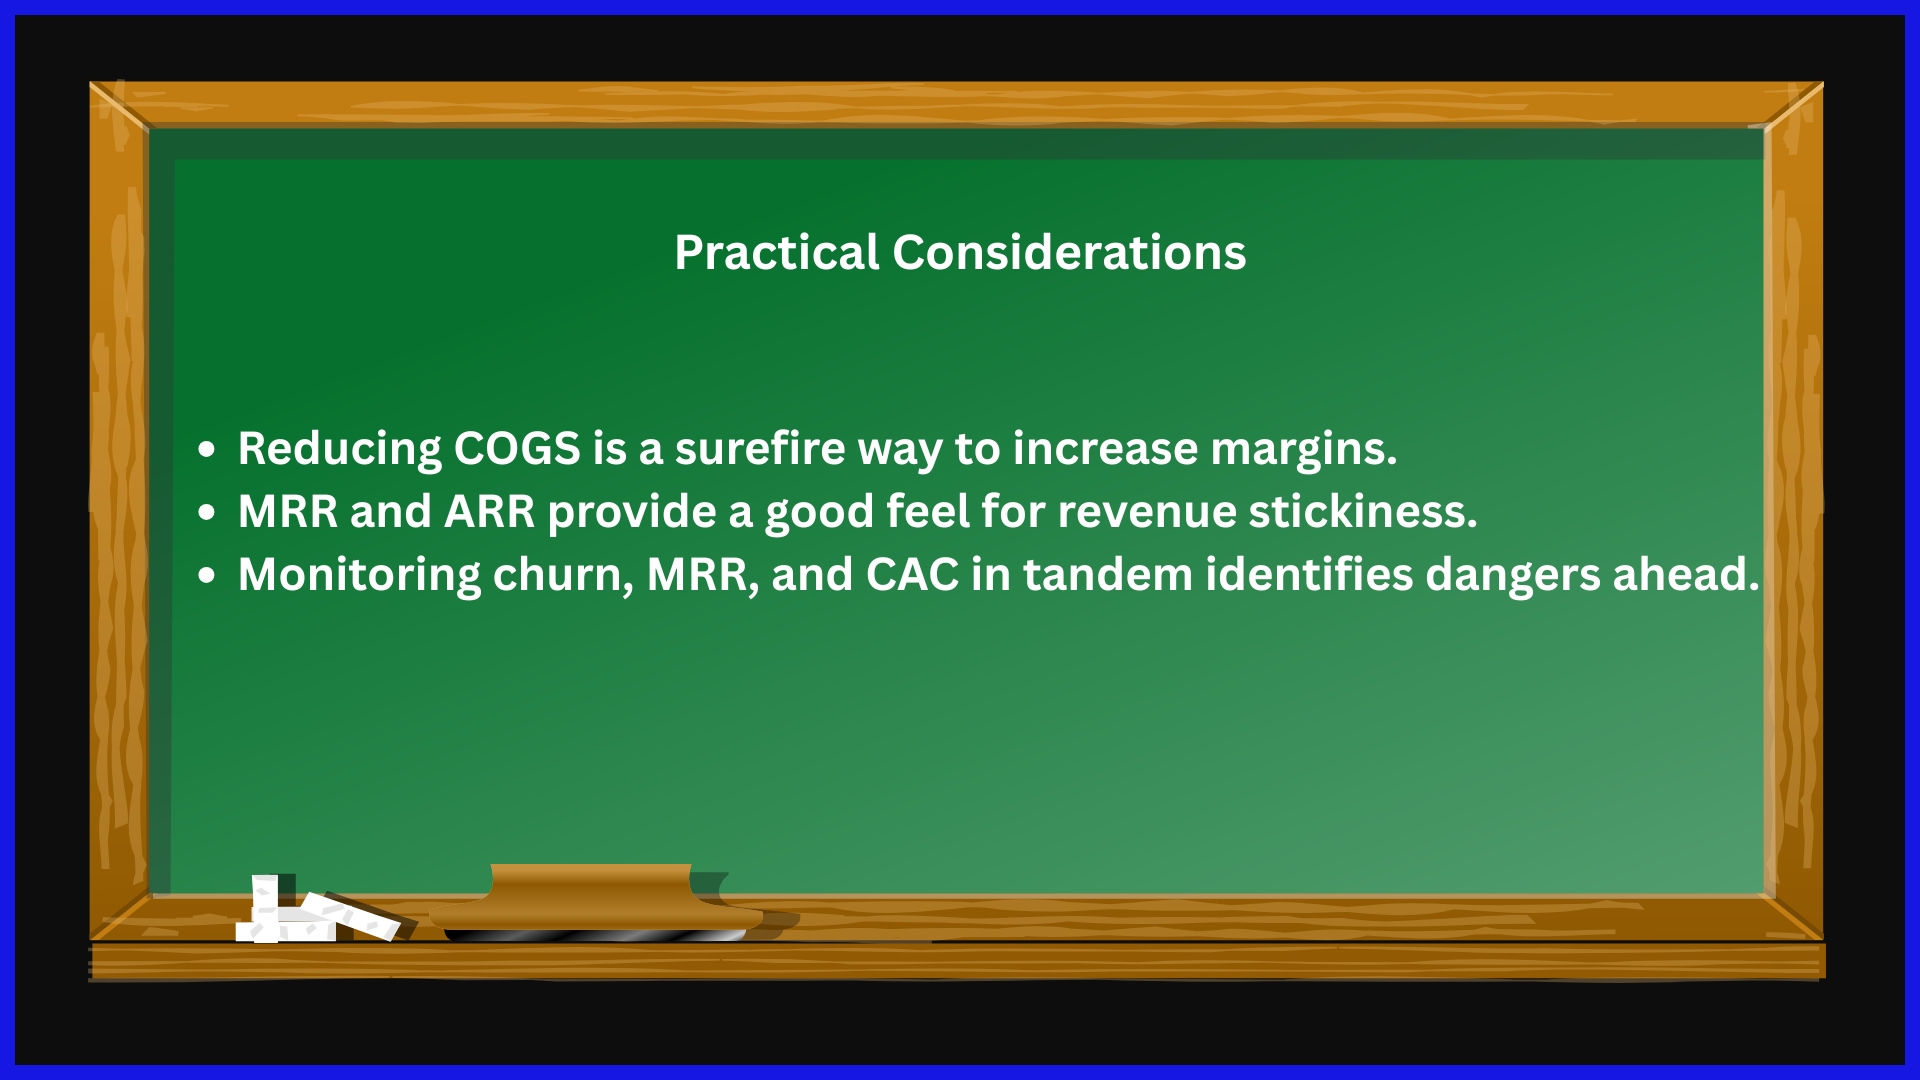
Monthly and annual recurring revenue (MRR and ARR) is a primary metric to track growth and stability. MRR provides a monthly perspective. ARR gives an annual one. Both are crucial for demonstrating recurring revenue and are a key area of attention for investors and boards.
-
Predictable cash flow enhances resource planning.
-
Dampens sales volatility versus one-off sales.
-
Boosts stickiness with recurring service.
-
Makes upselling and cross-selling easier.
-
Increases valuation by demonstrating forward revenue potential.
Recurring revenue placates investors who like to see companies with predictable, repeatable revenue. It increases valuation, demonstrating that the business is able to sustain growth.
Deferred Revenue
Deferred revenue is a crucial financial metric for SaaS startups, representing revenue collected before service delivery. For many SaaS companies, this means that payments from customers are often recorded as a liability until the service period concludes. This practice ensures that your financial model aligns with accounting standards and that your revenue is recognized accurately.
Deferred revenue highlights customer commitment. When customers pay upfront—especially for annual plans—it signals future cash flow, even if the revenue hasn’t been earned yet. Understanding this connection is vital for SaaS CFOs as it relates to customer acquisition strategies.
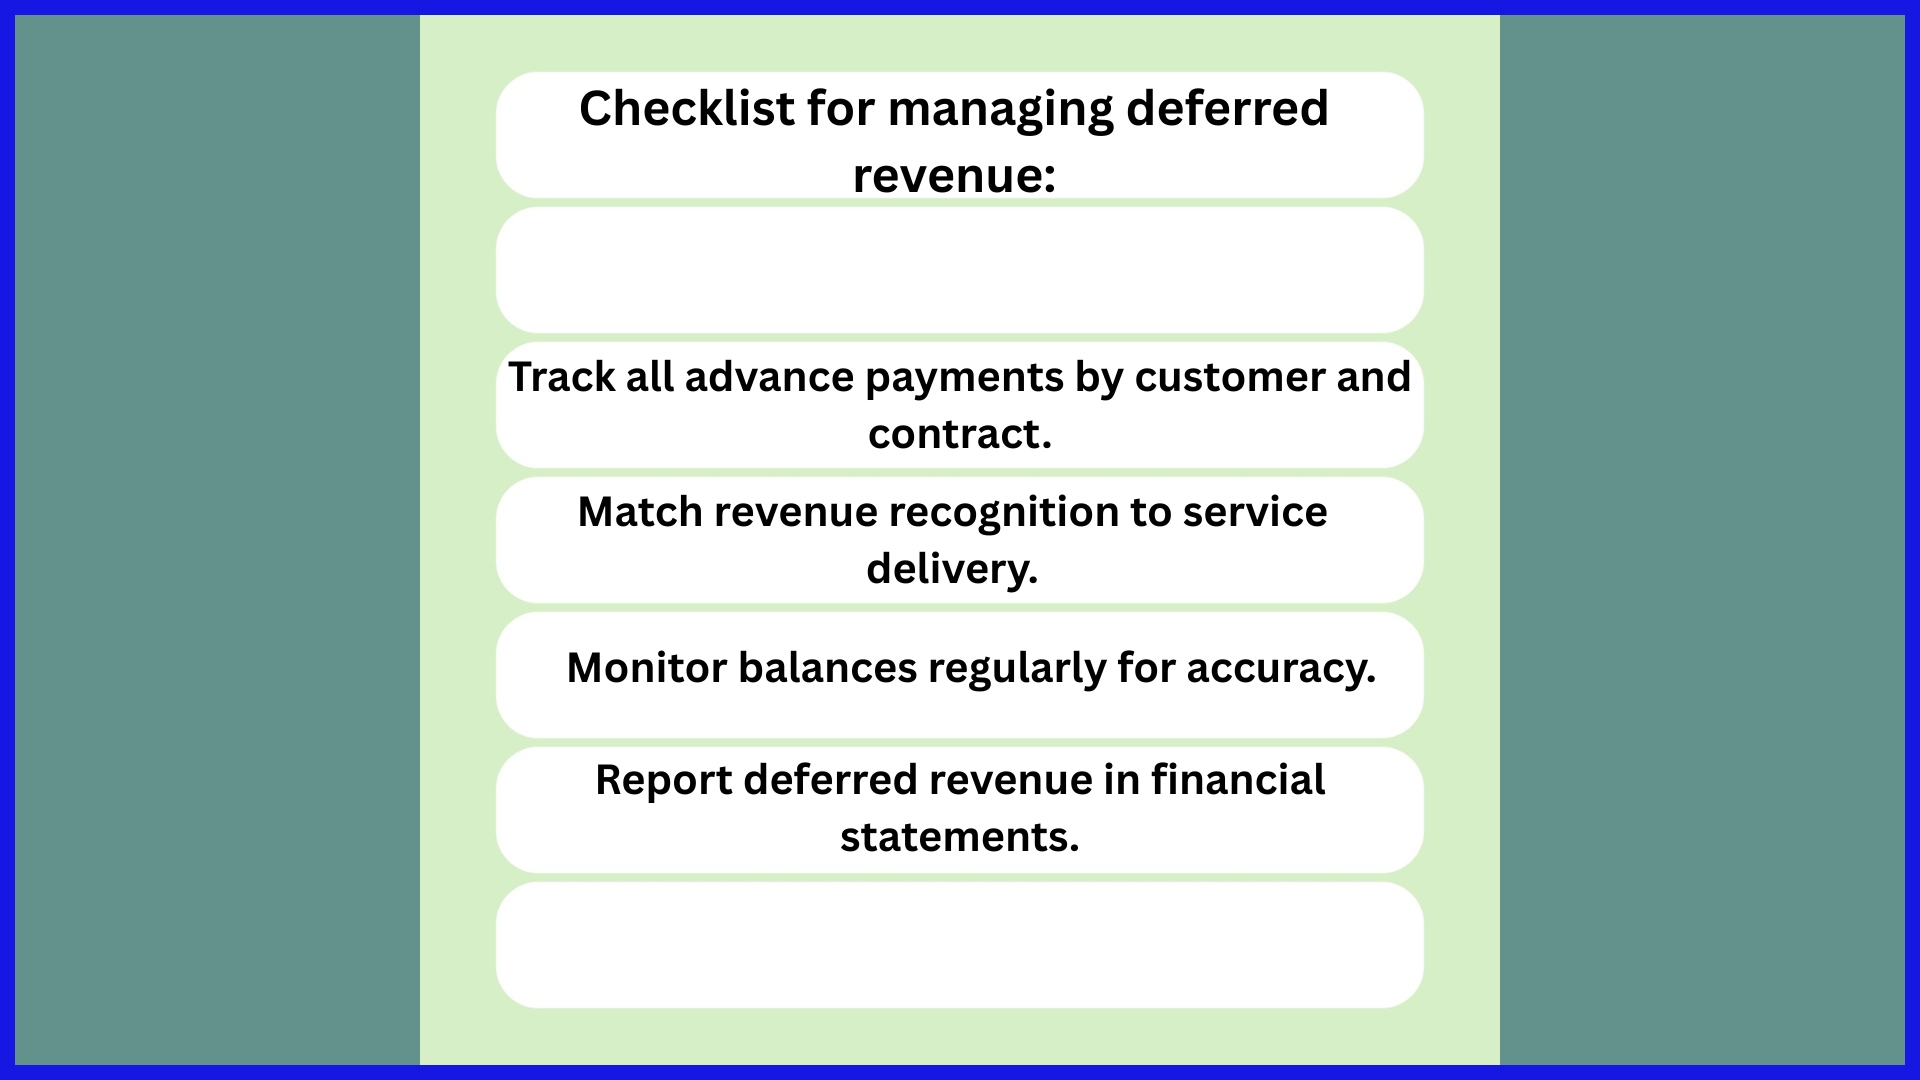
Annual discounts, for example, can enhance upfront cash flow, but firms must remain vigilant about revenue recognition. Balancing these factors is essential for maintaining a healthy SaaS company and ensuring overall profitability.
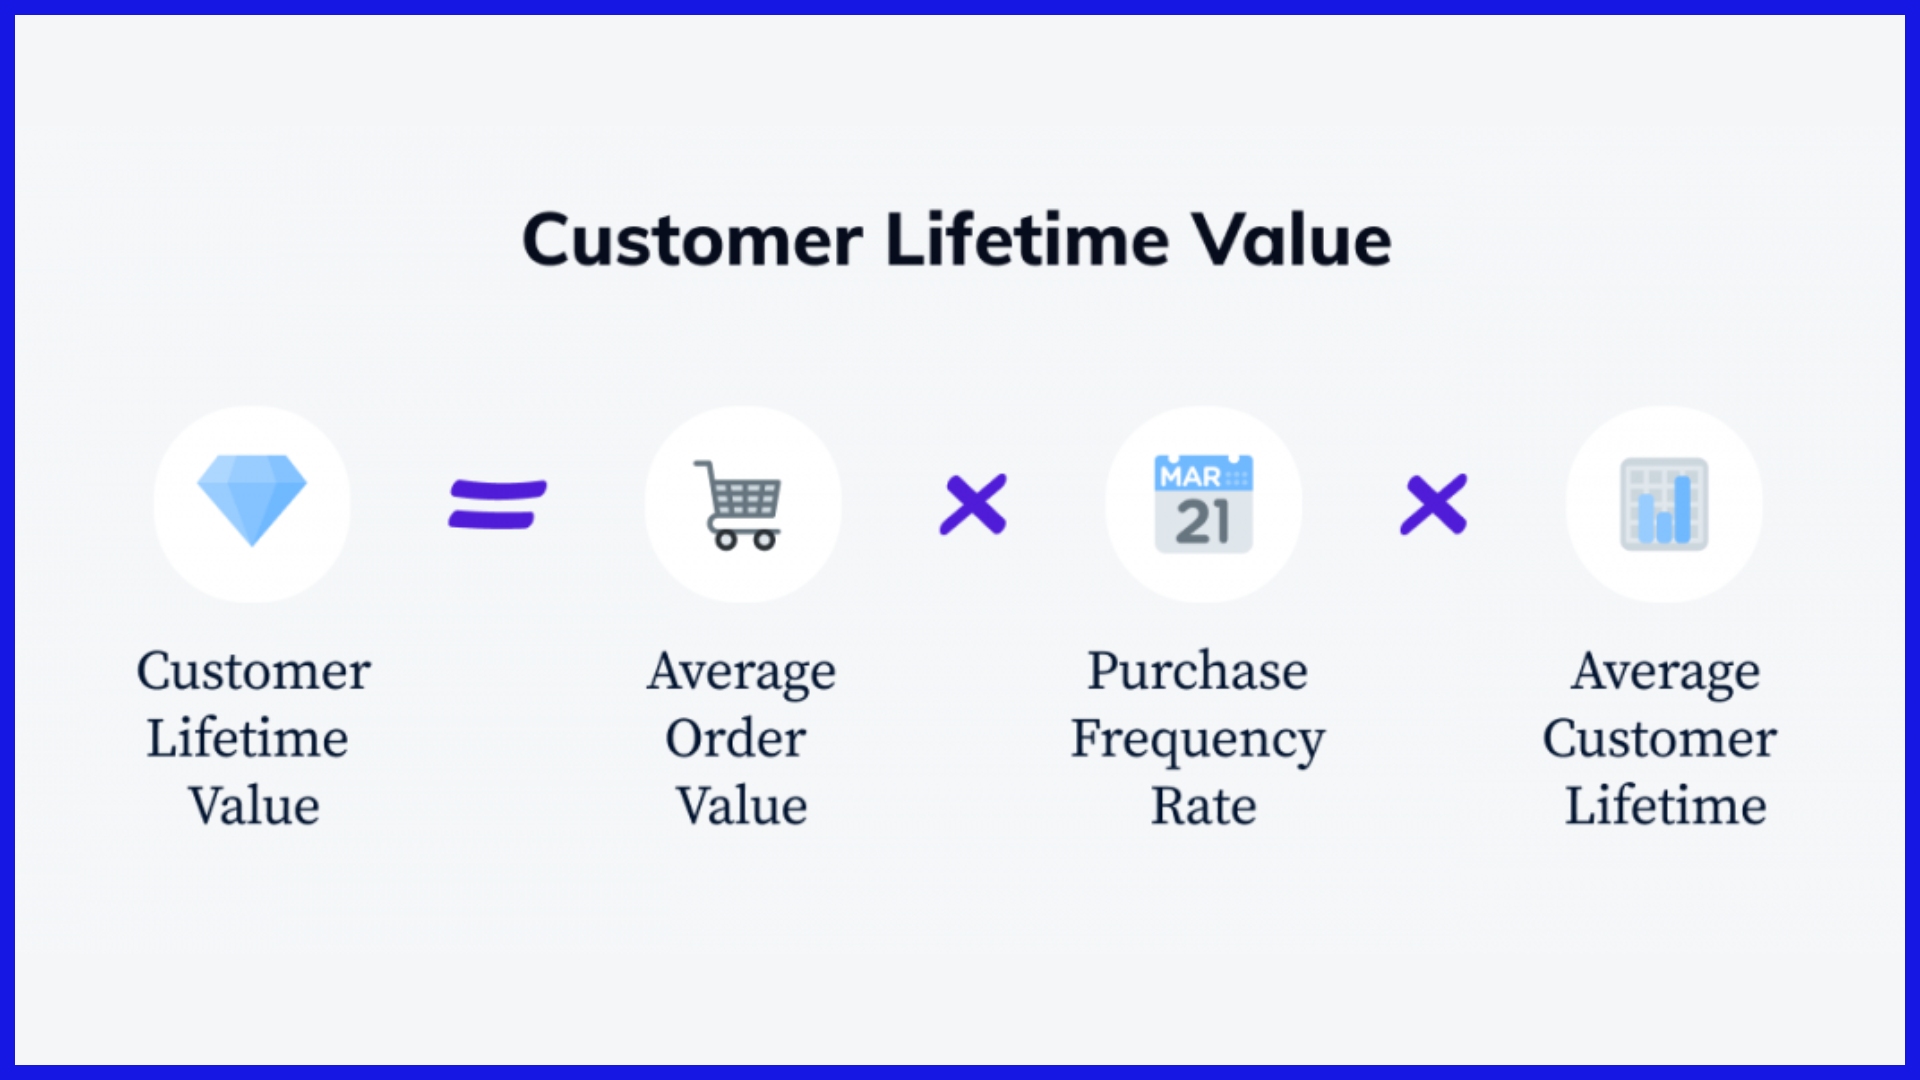
Customer Lifetime
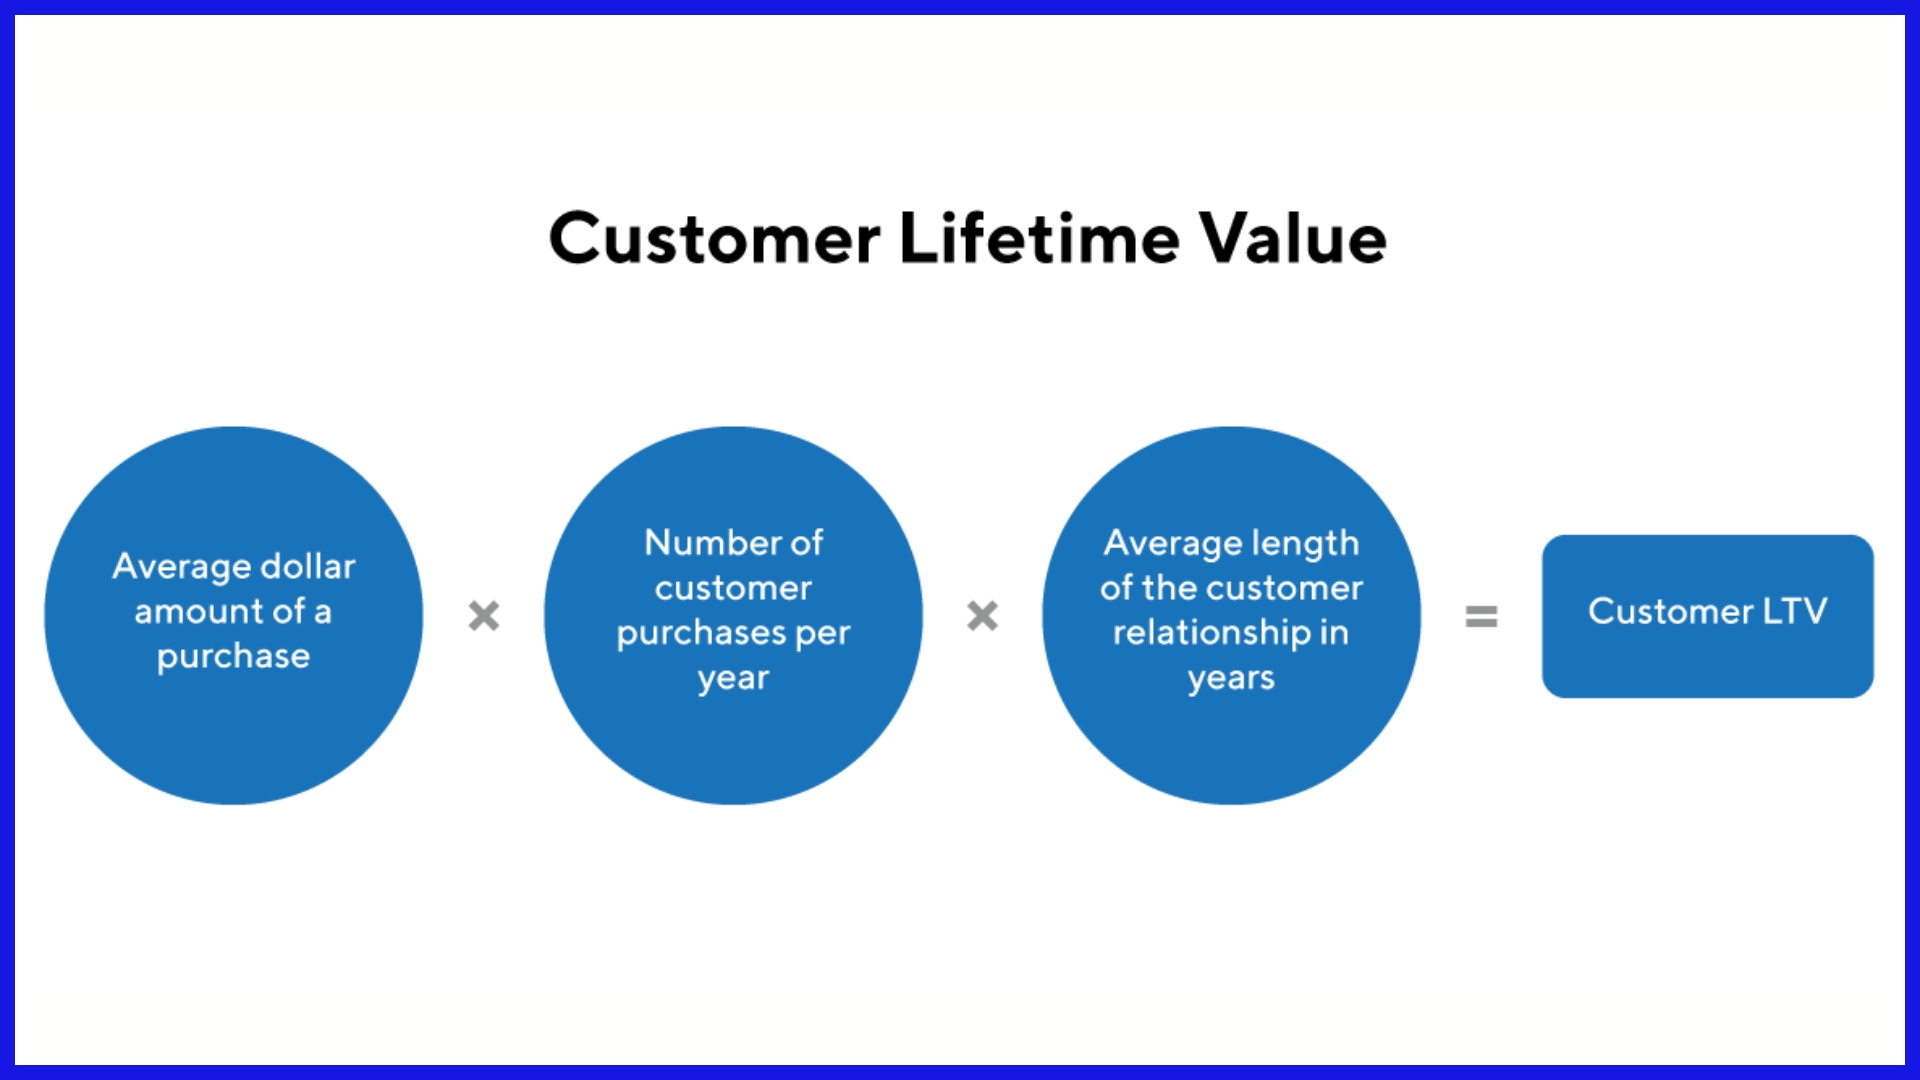
CLV says how much revenue a customer generates over their relationship with you. To calculate CLV, multiply average revenue per user by average customer lifespan, then subtract the cost to acquire and serve them.
Customer lifespan is contingent on engagement and satisfaction. Churn eats into lifetime and profitability. Comparing churn and NRR helps you identify where you should focus to enhance the customer experience and lifetime.
CLV insights help fine-tune marketing and sales. If CAC is high, concentrate on retention and upselling to current customers. Segmenting by lifetime value allows teams to target those best-fit customers with customized offers.
Customer lifetime data identifies profitable cohorts, allowing SaaS teams to concentrate resources in the right cohorts to increase revenue and decrease churn.
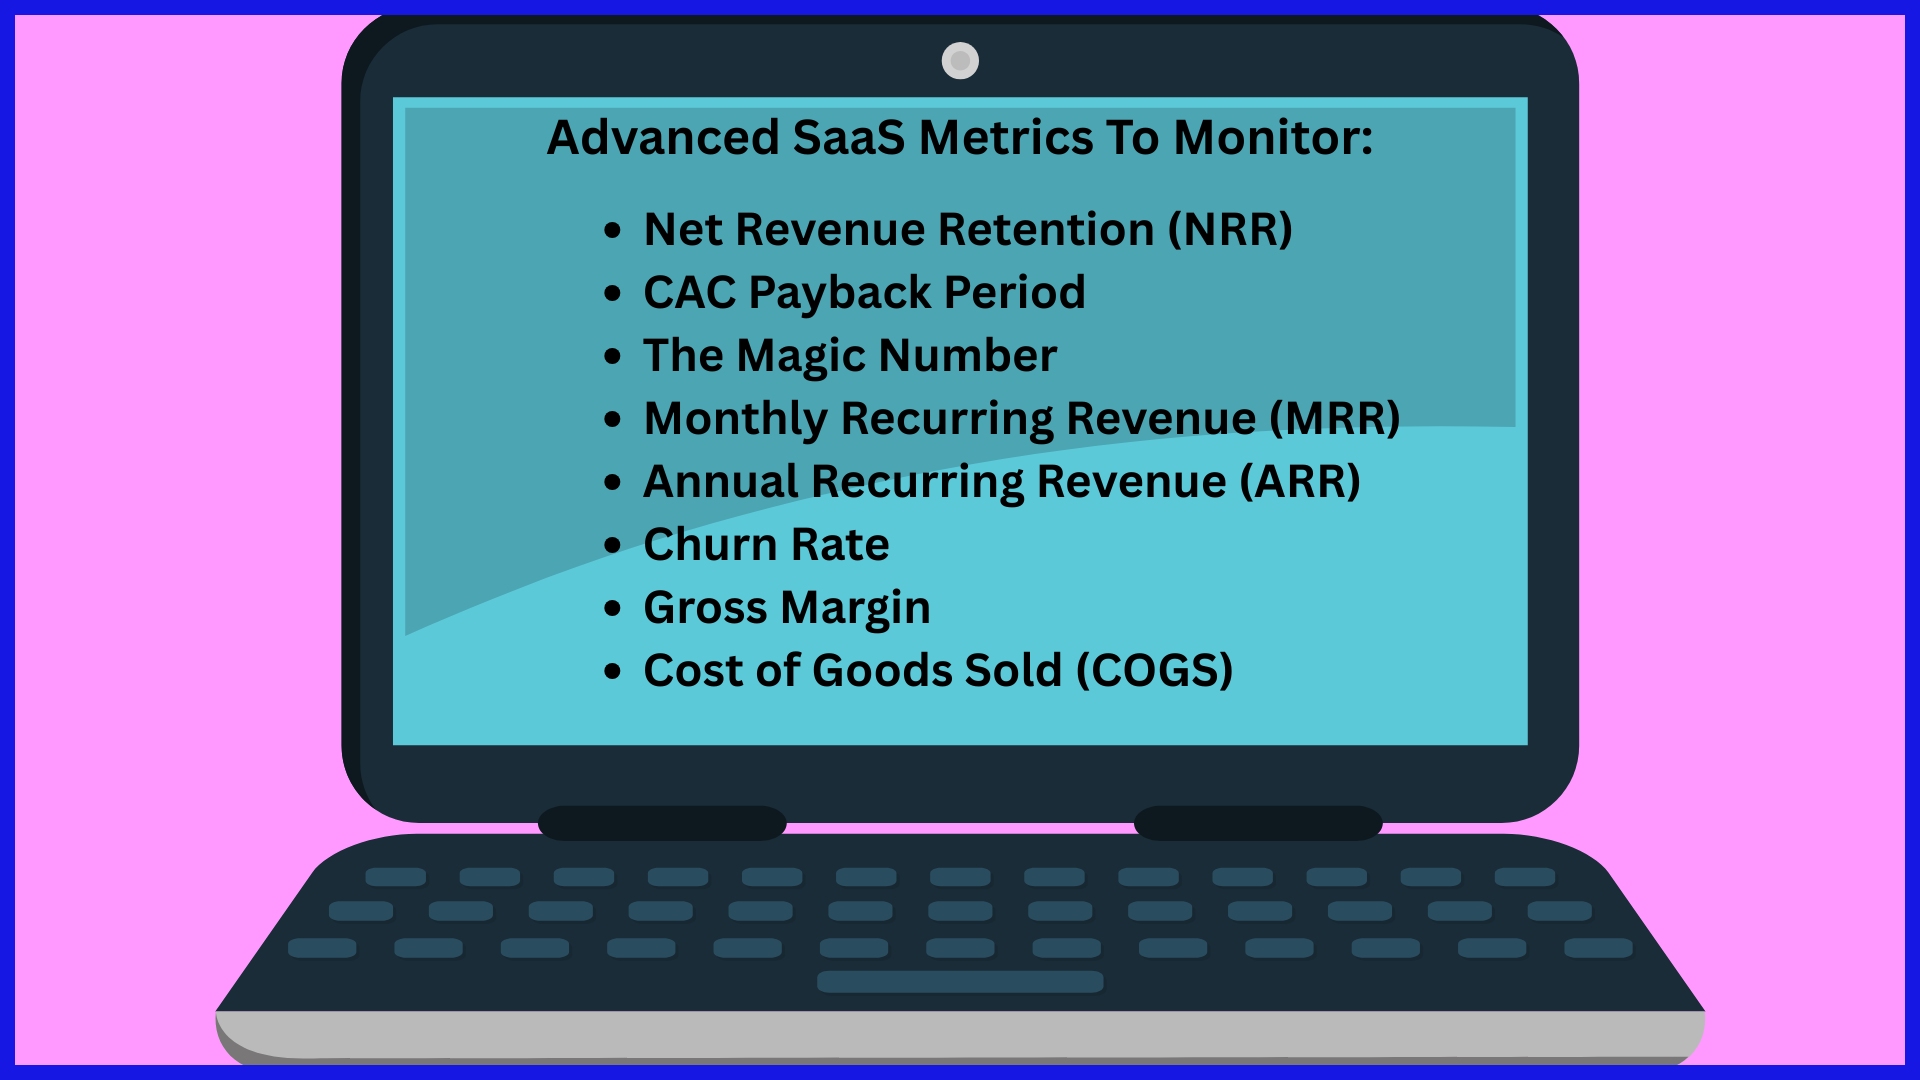
The Core SaaS Finance Metrics
The optimal SaaS finance metrics to track, such as revenue churn and customer acquisition strategy, allow SaaS startups to know how the business is doing, identify growth trends, and inform decision-making. These key metrics matter for agencies, teams, and SaaS buyers looking to keep operations efficient and profits steady, providing a complete view of how a SaaS business operates.
|
Metric |
Why It Matters |
Decision Impact |
|---|---|---|
|
MRR/ARR |
Shows recurring income, helps forecast and plan |
Guides hiring, budgeting, and cash flow |
|
CLV |
Measures the long-term value of customers |
Shapes product and marketing investment |
|
CAC |
Reveals the cost to gain customers |
Informs sales and marketing spend |
|
Retention Rate / NRR |
Tracks customer loyalty and future revenue |
Focuses on retention efforts |
|
Churn Rate |
Identifies lost customers |
Drives customer success strategy |
|
Rule of 40 |
Combining growth and profit to rate health |
Benchmarks overall performance |
|
SaaS Magic Number |
Gauge sales efficiency |
Adjusts sales/marketing investment |
|
CAC Payback Period |
Time to recoup acquisition costs |
Informs strategy by company type |
1. Revenue Metrics
MRR and ARR are the spine of SaaS accounting. MRR helps you see consistent revenue by leveling out the inconsistencies from varied billing cycles. This assists finance teams in planning and making intelligent decisions about hiring, new initiatives, and investment in marketing.
ARR provides an annual perspective, which is great for long-term planning. Monitoring revenue expansion (such as upsells or add-ons) and contraction (like downgrades or cancellations) gives insight into how customers utilize the product and identify opportunities to expand or address.
ARPU—average revenue per user—reveals whether pricing is effective or due for a plan revision. Benchmark all these figures against industry standards to determine how your business is faring and what areas require attention.
2. Customer Value
CLV, or customer lifetime value, informs you about the revenue a customer contributes prior to their exit. Put CLV up against CAC, and you have an idea if your customer acquisition efforts pay off over time. A CLV to CAC ratio above 3:1 is a common target.
Segmenting customers by value allows teams to prioritize retention efforts for their best users and directs marketing spend where it’s most effective. These insights inform product development—if a high-value segment desires new features, it’s usually worth building.
3. Acquisition Cost
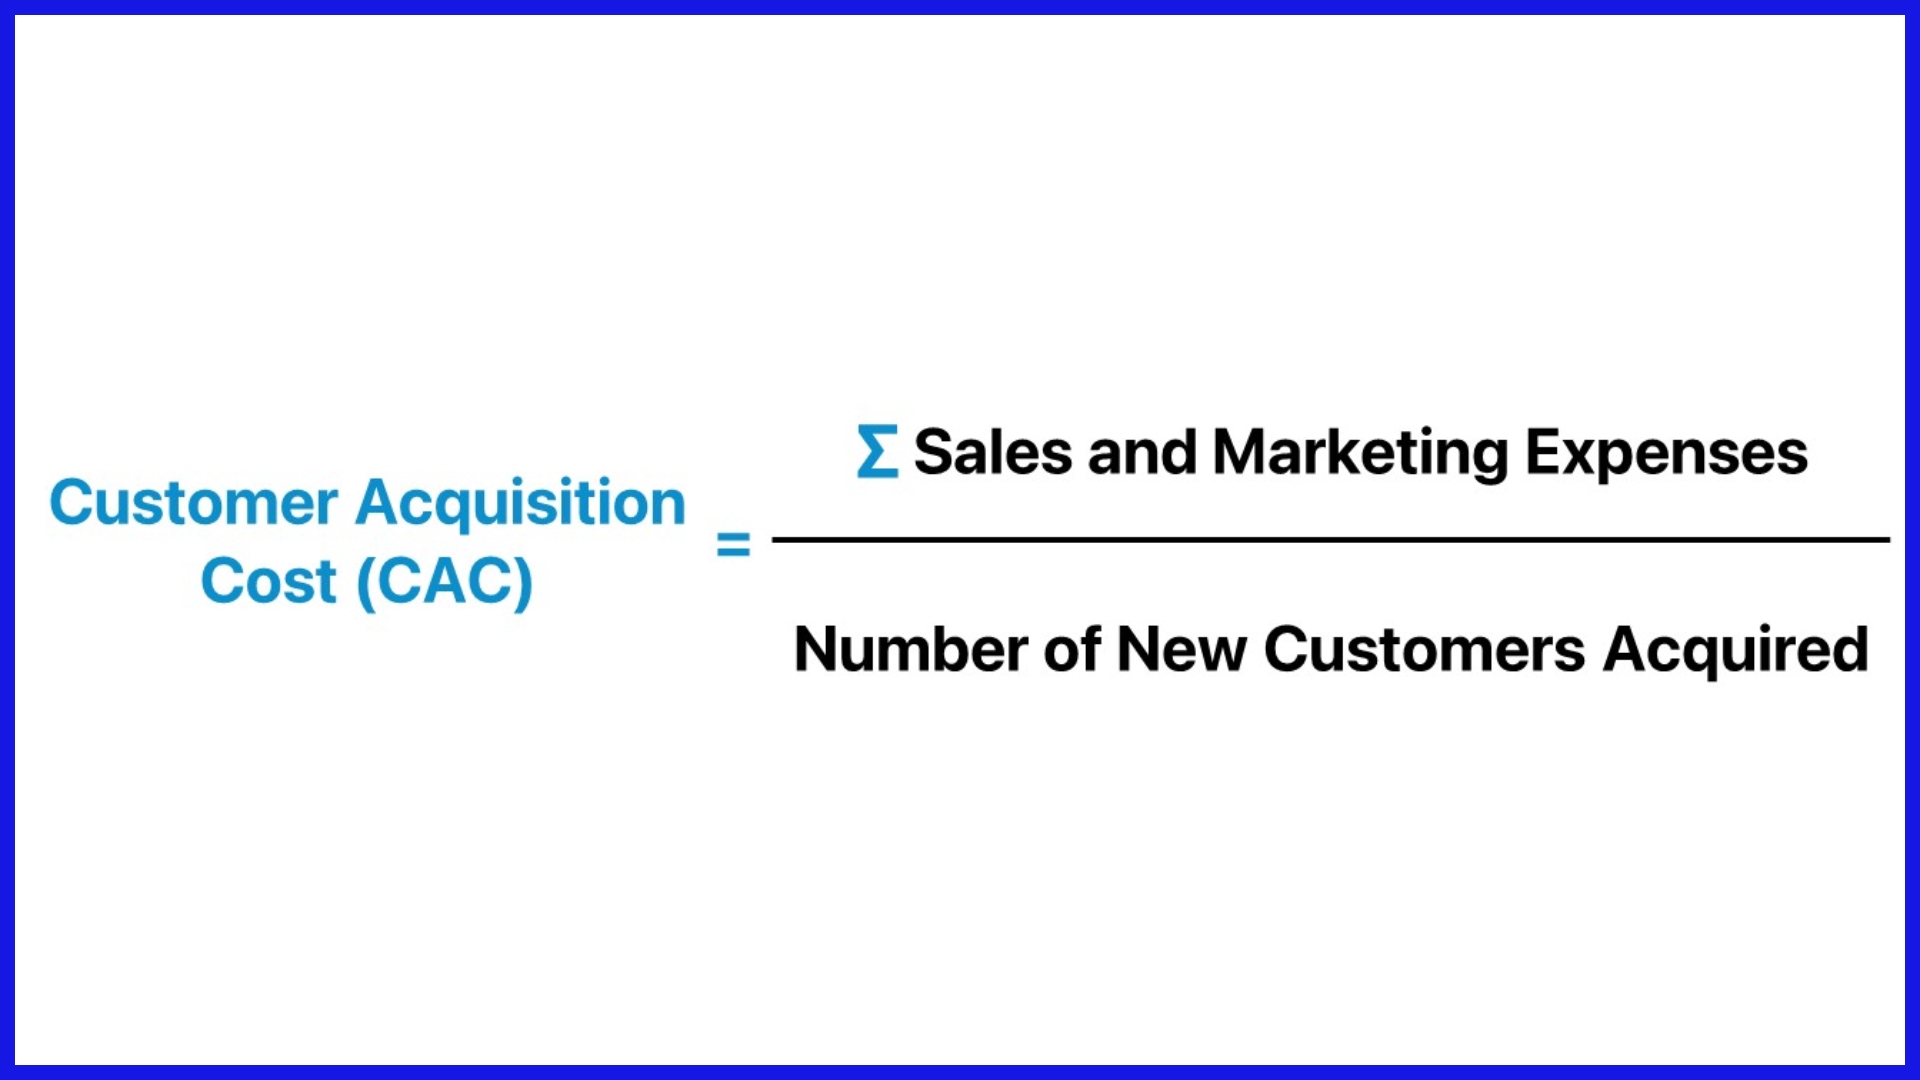
CAC is critical for monitoring whether your sales and marketing spend pays off. Benchmark this number to discover if you’re overspending or underspending against like-sized SaaS businesses. The CAC payback period demonstrates how quickly you can recoup your investment to capture a new customer.
That number changes depending on if you sell to consumers, SMBs, or enterprises. Reducing CAC or reducing the payback period liberates cash for growth.
4. Retention Rate
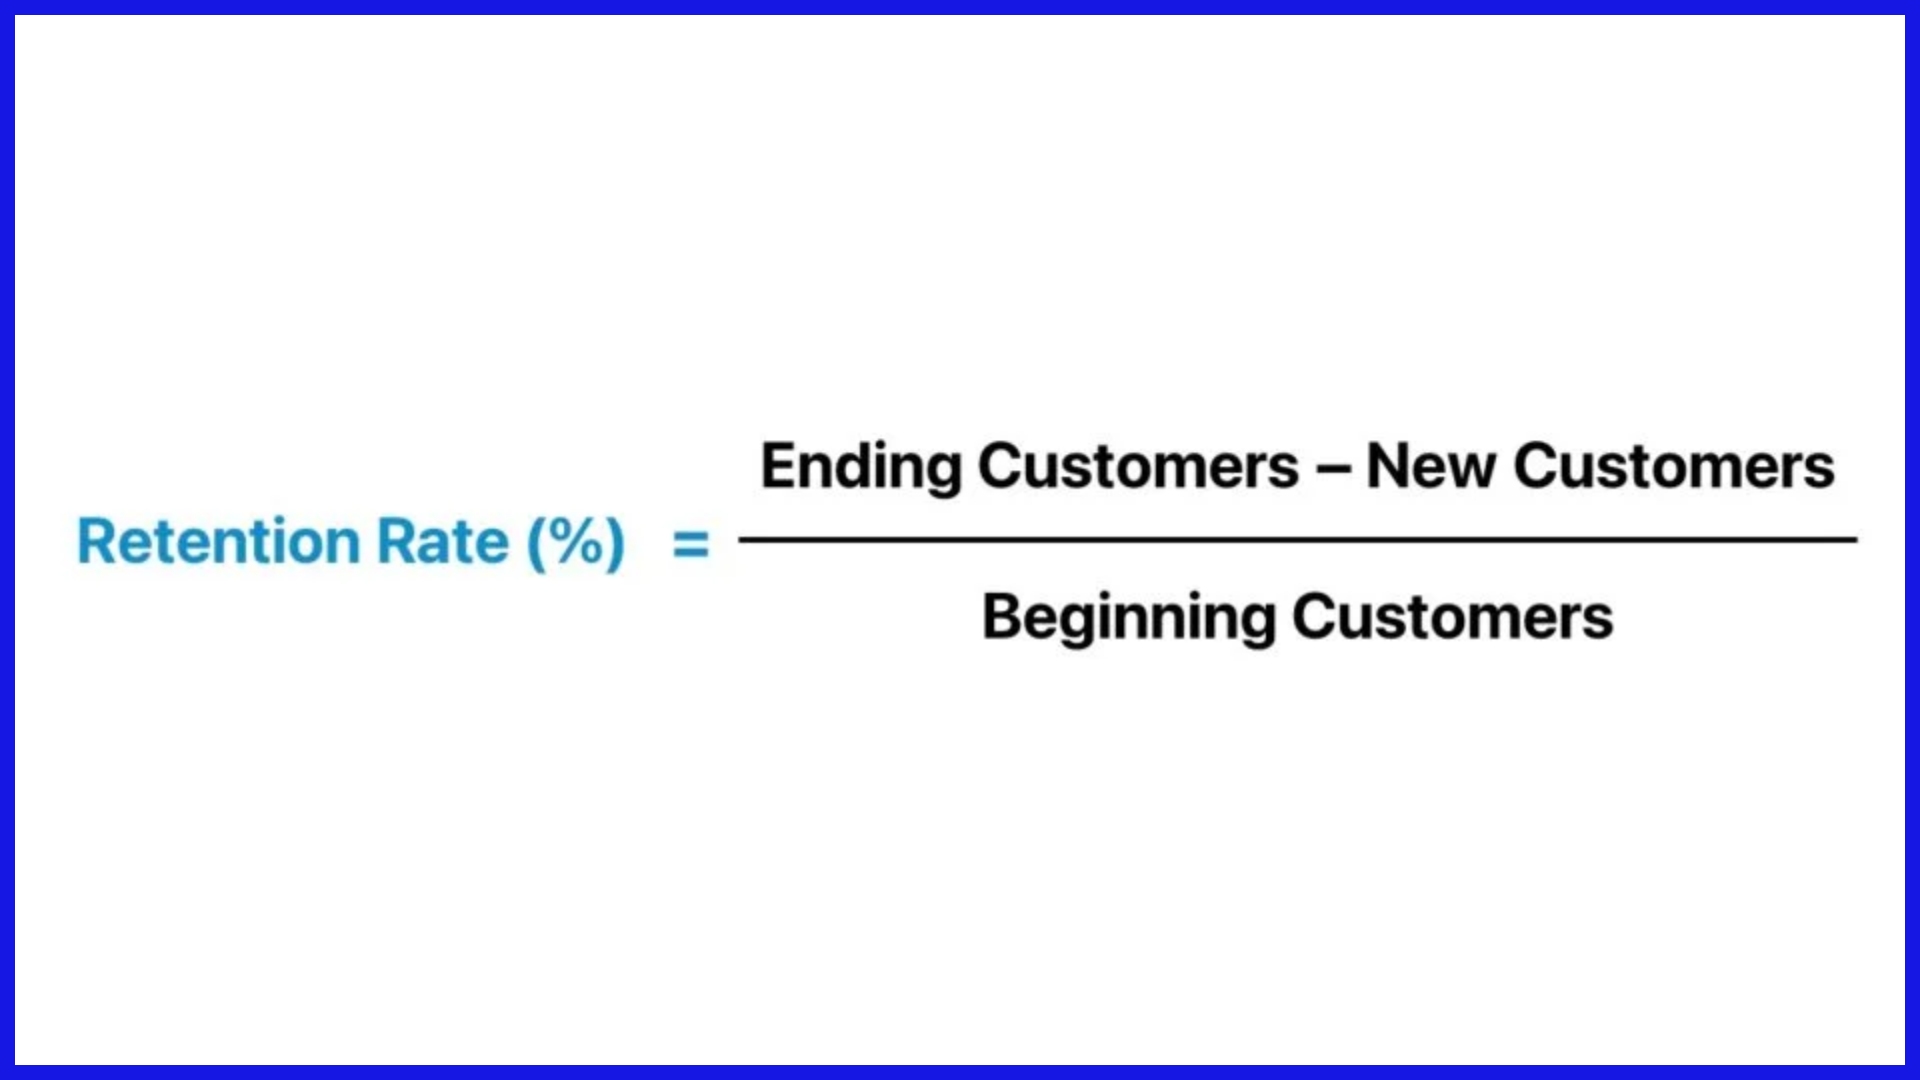
Retention rates measure how many customers stay. Churn rate reveals the reverse—how many unsubscribe. Both numbers assist teams in identifying what’s working and what’s not in customer success.
High retention and low churn mean stronger revenue and less pressure to source new customers all the time. Contrast retention to industry averages to see if you’re on course.
Beyond The Basics
SaaS companies go beyond basic revenue accounting and concentrate on a collection of sophisticated financial metrics in order to form smarter strategies. These metrics allow teams to identify patterns, project expansion, and discover opportunities to increase revenue and retain customers. Financial modeling, do companies bill monthly or yearly, is key for long-term health and profit.
Through the income statement, balance sheet, and cash flow statement, SaaS teams gain visibility into cash flow and profitability. Data analytics tools provide additional control over pricing, churn, and growth initiatives.
Net Revenue Retention
Net revenue retention (NRR) is an important KPI for SaaS companies. It captures the effect that upsells and cross-sells have on revenue growth by measuring the amount of recurring revenue retained from existing users over a specified timeframe. This figure accounts for upgrades, downgrades, and churn, providing a complete representation of customer value.
A high NRR — preferably above 100% — indicates that customers aren’t just sticking around, they’re spending more over time. Such robust retention is typically an indicator that users are happy and perceive continued value, so churn is low. That’s because companies with good NRR have steadier revenues and loyal customers that fuel efficient growth.
SaaS teams leverage NRR to plan customer success. By following NRR trends, they can observe what initiatives — whether it be onboarding programs or support efforts — truly make an impact. NRR against industry benchmarks indicates whether a company is ahead or behind the curve, highlighting opportunities for optimization or expansion.
CAC Payback Period
The CAC payback period indicates how fast a company recoups what it spends to acquire a new customer. To calculate this, divide your overall sales and marketing spend by the monthly gross profit contributed by new customers.
A shorter CAC payback period indicates the company is recovering investments more quickly, which keeps cash flow robust and helps spark growth. If it takes too long to break even, profits shrink and scaling slows down. This number is connected to both the company’s financial health and whether or not a business model is viable.
SaaS companies look at the CAC payback period to determine ad spend, sales teams, or new markets. They benchmark their CAC payback against the industry. If it’s above average, perhaps it’s time to revisit sales methodologies, trim expenses, or tweak marketing copy.
The Magic Number
The Magic Number is a fast way to verify whether sales and marketing investments are rewarding. It’s computed as the change in quarterly recurring revenue divided by the previous quarter’s sales and marketing spend.
Magic Numbers nearing the 0.75–1.0 range are generally viewed as healthy. If it’s significantly lower, growth is too expensive. If significantly higher, the business might be scaling quickly but might be in jeopardy of quality or customer experience. This metric assists SaaS leaders in balancing growth and profit.
Teams check the Magic Number when determining whether they should accelerate hiring or pause. By benchmarking against peer SaaS businesses, it will indicate if they’re in a good position or steering in the wrong direction.
Operational Health Indicators
Operational health indicators are fundamental metrics that indicate whether a SaaS business operates efficiently, manages expenses, and remains sustainable. These operational health indicators help leaders identify risks, map resources, and visualize how modifications impact the bottom line.
The key is to maintain these metrics in balance, as they indicate how robust your operations are. These are typically finance, sales, or marketing indicators and include gross margin, burn rate, and the Rule of 40. By monitoring these as KPIs, you can monitor progress, respond early to issues, and adapt for long-term growth.
|
Indicator |
What It Shows |
Impact on Stability |
|---|---|---|
|
Gross Margin |
Profit from core operations |
Higher margin means more flexibility and profit potential |
|
Burn Rate |
The speed at which cash is spent |
Lower burn rate extends cash runway and reduces risk |
|
Rule of 40 |
Balance of growth and profit |
Scores over 40% signal good health |
|
Churn Rate |
Rate of customer attrition |
Lower churn boosts profits, stability, and growth |
Gross Margin
Gross margin indicates how much money a company earns after incurring direct costs associated with its product or service. It’s calculated as (revenue – cost of goods sold) / revenue x 100. For SaaS, that usually implies deducting hosting or support costs from the top line.
Top-notch gross margins leave you more money for innovation, sales, or customer support. A healthy gross margin reflects operational efficiency. It helps leaders decide where to eliminate expenses and where to invest.
If your gross margin is way higher than peers, it may reveal a true competitive advantage in pricing or cost control. For instance, a SaaS business with 85% GM can deploy more back into growth than a peer with 60%.
While gross margin benchmarks differ by industry, SaaS companies, for example, generally aim for 70% and above. Benchmarking your figures against the industry identifies strengths or weaknesses. These are the kinds of insights you can use to trim pricing, supplier contracts or discover new cost-cutting opportunities.
Burn Rate
Burn rate is how quickly the company goes through its cash. To get there, subtract monthly operating costs from cash income. This figure indicates how many months the company can operate before it must raise new capital.
A burn rate that’s too high is dangerous if it isn’t accompanied by high-growth or a path to additional funding. By tracking burn rate, leaders can identify when to trim spending or reconsider hiring plans.
Burn rate operates alongside cash runway, indicating the number of months before cash runs out. SaaS firms, in particular young ones, should verify this regularly as good management.
So it’s smart to benchmark your burn rate. If your number is significantly higher, it may signal too much risk or indicate a need to reduce expenses.
Rule of 40
The Rule of 40 is a quick method to evaluate the growth and profitability balance. Take your growth rate and add it to your profit margin. Anything above 40% indicates your business is healthy.
If a SaaS grows 30% a year with a 15% margin, the sum is 45%. That’s an indicator of robust health. This rule aids investors and leaders in determining if growth occurs at the expense of profit, or the other way around.
Companies apply the Rule of 40 when making investment decisions or allocating resources. If you’re under 40%, it’s a signal to do better on growth or profit margin or both.
Other Key Indicators
Churn rate indicates the percentage of customers lost during a period. A mere 5% decline in churn can translate into a serious profit surge.
It’s calculated as (lost customers / total customers) x 100. Lower churn means more stability and room for growth.
The Interconnected Metric Web
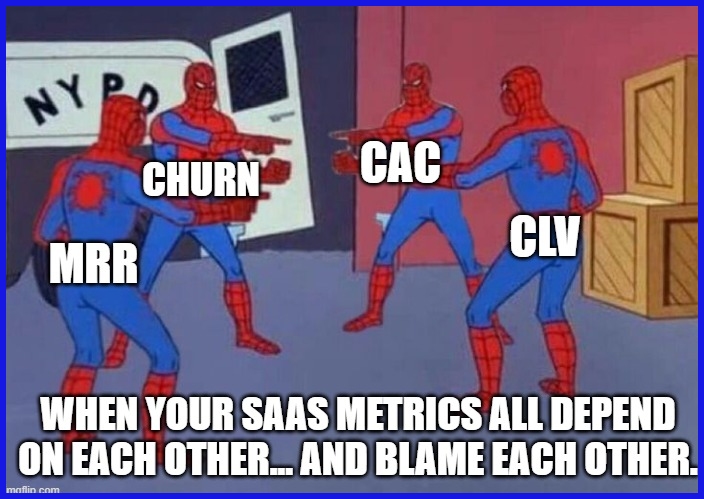
The interconnected metric web in SaaS finance, particularly for SaaS startups, ties growth, efficiency, and predictive metrics together, providing a holistic snapshot of financial health. Each metric connects to others, illustrating how decisions in one domain can impact the entire SaaS business model. By monitoring and evaluating these key SaaS metrics in unison, companies can identify patterns, enhance strategies, and gauge where to concentrate next.
Balancing Growth
Growth metrics such as MRR, active users, and lead conversion rate demonstrate how effectively a SaaS company is capturing new business. A growth fixation can damage long-term success if profitability is overlooked. Balancing growth and profit means monitoring CAC with CLV and churn.
For instance, if CAC increases but CLV remains flat, marketing spend perhaps requires a reconsideration. Leveraging growth metrics to direct its marketing and sales efforts helps it identify the right customers for lasting growth.
Looking at results versus industry benchmarks can reveal whether a firm’s growth rate is ahead of or behind the curve, helping you set realistic goals and identify exceptional strengths.
Gauging Efficiency
Efficiency appears in how effectively a company uses its people, time, and money. Core efficiency metrics are gross margin, support ticket resolution time, and average revenue per employee. These figures signal inefficiency or lost opportunities, and a slim gross margin can indicate expensive or under-utilized software.
Examining operating expense ratios and process turnaround times, for example, can help steer where to trim or refresh. Examining efficiency relative to peers can reveal gaps or opportunities — for example, to accelerate onboarding or minimize support costs — that increase both profit and customer satisfaction.
Predicting Future
Predictive metrics — forecasted MRR, renewal rate projections, pipeline conversion ratios — help SaaS leaders plan for what’s next. We now have an interconnected metric web.
For example, looking at historical churn and upsell behavior provides insight into probable future monthly revenue. These predictions inform decisions surrounding hiring and new product launches, and expansions into new markets.
By getting predictions right, it’s easier to guide investments or pivot plans before trends take hold. It’s this comparison between forecasts and actual outcomes that is the secret to becoming a better forecaster.
Building a Holistic View
Connecting growth, efficiency, and predictive metrics provides leaders with a complete view. This metric web enables smarter financial modeling, sharper strategy planning, and more resilient day-to-day operations.
A good metric web transforms a jumble of digits into luminous understanding.
Common Financial Pitfalls
SaaS finance metrics play a crucial role in guiding strategic decisions for SaaS startups, but common pitfalls can jeopardize growth. Recognizing these challenges helps teams build a sustainable financial model for future growth.
-
Failing to prioritize debt payments by interest rates or balances can soon result in large financial headaches. High-interest debt, if unchecked, grows quickly and chews through cash flow. Businesses, on the other hand, should concentrate on extinguishing their highest-interest liabilities as quickly as possible, keeping interest costs low and unearthing capital to invest back into their core activities.
-
Brushing aside rules such as GDPR can lead to large fines—up to €20 million or 4% of annual revenue. Non-compliance can damage brand trust, too. It’s savvy to have a strategy for addressing and keeping up with any applicable regulations, regardless of where customers are located.
-
Ignoring the proper alignment of revenues and expenses when calculating CAC Payback Period results in flimsy metrics. For instance, optimizing against total revenue rather than recurring revenue to benchmark against acquisition costs may indicate a payback that’s faster than the truth. This can make a business appear healthier than it is and create urgency to drive rash spending or scaling decisions.
-
Defining ARR with your own custom or murky definitions confuses everyone internal and external to the company. I think investors and teams have to be aligned. Adhering to common definitions and transparent reporting standards prevents misunderstandings and facilitates progress comparisons.
-
Poor cash flow is another favorite stumbling block, particularly for early-stage SaaS ventures. Missed bills and late payroll strain vendor and employee relationships. Tracking cash inflows and outflows, and employing some basic forecasting, keeps these shortfalls at bay.
-
Overlooking retention costs can sap. The expense of maintaining existing users typically receives less focus than acquiring new ones. Budgeting for retention is key–look for LTV to be 3x CAC. Monitoring retention metrics and expenditures keeps these costs from spiraling.
-
Debt, when employed properly, gives startups a lift. Leaning on it too often without defined parameters or a repayment strategy can foster an endless loop. Teams should only assume debt with a repayment plan and an actual necessity.
-
The SaaS financial landscape is complicated, and missing foundational financial practices can prevent long-term growth. Establishing a foundation of good habits and consistent metric reviews makes for more consistent success.
Conclusion
To monitor SaaS growth, savvy teams rely on actual metrics. Metrics such as MRR, churn, CAC, and LTV provide exactly that direction. These reveal where cash flows, where leakage lurks, and where triumphs pile up. Real cash comes from more than just signups. Health checks like cash burn or quick ratio keep teams honest. Slack or slip-ups sting quickly, but close monitoring aids in identifying stress sooner.
Good SaaS teams keep it simple, select the right metrics, and let them drive each phase. For some clarity, give a tool a shot that aggregates all your metrics into a single pane of glass. To call them better, keep your numbers close and your eyes open. Just check out KPI.me for simple, custom reports.
Frequently Asked Questions
What makes SaaS finance metrics different from traditional business metrics?
SaaS finance metrics, such as customer retention and revenue churn, are crucial for SaaS startups, emphasizing the importance of lifetime customer value and subscription growth.
Which core finance metrics should every SaaS company track?
Metrics such as MRR, CAC, LTV, Churn, and Gross Margin are key metrics for saas startups, ensuring healthy business growth and sustainability.
Why is Customer Churn Rate important in SaaS finance?
Churn Rate, a key metric for many SaaS companies, indicates the rate at which you are losing customers. High churn signifies potential product or retention issues, threatening recurring revenue and long-term growth.
How does Gross Margin impact a SaaS company’s financial health?
Gross Margin indicates the profit after deducting costs to deliver the service, providing key SaaS companies with a gross margin to invest in growth and ensure sustainability.
What are operational health indicators in SaaS finance?
Operational health indicators, such as NRR, ARPU, and payback period, are key metrics that capture efficiencies in cost, revenue, and customer value for saas startups.
How are SaaS finance metrics interconnected?
Most SaaS metrics, such as customer retention strategies and revenue churn, impact each other. For instance, if you decrease churn, you’ll increase LTV, improving the LTV: CAC ratio. Understanding these connections drives smart business decisions.
What common financial pitfalls should SaaS companies avoid?
Typical mistakes in many SaaS companies include ignoring churn, inflating acquisition costs, and neglecting to track cash flow; monitoring key SaaS metrics ensures sustainable growth.