
Top Stripe Financial Metrics that you should be on top of
Key Takeaways
-
Following essential Stripe financial metrics like revenue, profit margins, or customer lifetime value can help businesses make better decisions and optimize growth strategies.
-
Watching transaction health and payment processing data uncovers trends and insights to improve operational efficiency and customer experience.
-
It’s important to quantify customer acquisition, retention, and churn rates as these figures heavily into understanding how your customers behave and where to focus your marketing efforts.
-
Subscription businesses do better with metrics such as recurring revenue, stickiness, and downgrade impact.
-
Payment disputes, refunds, and recovery speed support help review better customer satisfaction and optimize dispute resolution.
-
With intuitive visualizations and BI dashboards, teams can grasp financial performance at a glance and communicate insights with stakeholders for data-driven decisions.
Top Stripe financial metrics are key figures that assist in monitoring payments, revenue, refunds, and customer behavior on Stripe. Important metrics such as gross and net volume, new customers, churn, failed payments, and refund totals.
Agencies and SaaS teams, for example, tend to monitor these figures to identify patterns and make rapid decisions. This post shares the fundamental Stripe metrics, why they’re important, and how to apply them for wiser planning and growth.
Core Stripe Financial Metrics

Stripe’s financial metrics, including customer engagement metrics and retention metrics, provide transparent insight into revenue, profit, and customer value. These important metrics matter to agencies, SaaS teams, and global businesses looking for reliable, actionable figures. Knowing your core Stripe stats enables companies to monitor growth, identify trends, and optimize decisions to keep the cash flowing.
| Metric | Definition | Methodology/Calculation | Business Impact |
|---|---|---|---|
| Total Revenue | All income received over a period | Sum of all payments processed | Measures growth, cash flow, and performance |
| Average Revenue Per User | Revenue divided by the number of active users | Total revenue / Number of active users | Identifies profitable segments |
| Gross Merchandise Value | Value of all transactions completed | Sum of all goods/services sold | Shows sales volume and business activity |
| Revenue Churn Rate | Lost revenue as a percent of total revenue | (Lost revenue / Total revenue) x 100 | Indicates retention and stability |
| Profit Margin | Profit after processing and Stripe fees | (Net revenue – Costs) / Net revenue x 100 | Assesses efficiency and sustainability |
| Customer Lifetime Value | Expected total revenue from a customer over their lifespan | Avg. value per purchase x Purchase frequency x Lifespan | Gauge long-term profitability |
| Payment Decline Rate | Percentage of failed payments | Failed payments / Total attempts x 100 | Flag payment process issues |
| Monthly Recurring Revenue | Predictable monthly income from subscriptions | The sum of recurring payments each month | Forecasts stable revenue streams |
1. Revenue Reality
Total revenue tracking shows the pulse of your business. With Stripe’s pay-as-you-go model, you only pay for what you process — so every cent counts toward your bottom line. Total revenue underscores growth, and ARPU indicates segments that provide the most value.
Looking at the revenue churn rate allows you to determine if lost customers are eating into revenue. For instance, high churn might indicate a need to enhance customer experience or pricing. Revenue trends aid in predicting future income, which drives more effective planning and allocation of resources.
2. Profitability Picture
Profit margins indicate how much you retain after processing payments and covering Stripe’s standard 2.9% + $0.30 per transaction fee (for domestic cards). This is crucial for agencies and SaaS firms with tons of small payments.
Customer acquisition cost informs the amount spent on ads and outreach, so growth remains sustainable. Total sales volume is another simple metric — it tells you if your sales efforts are effective, or if you need a new strategy.
Digging into customer data can identify high-value customers–those who buy frequently or at high levels–helping to tailor retention efforts.
3. Transaction Health
Payment decline rates mark problems with cards or the actual payment process. Stripe’s data can indicate if declines are increasing and where to correct them.
Monitoring successful transactions allows you to analyze payment flow effectiveness. Digging into transaction history reveals when and how customers pay, and what patterns might help suggest upsells or new products.
Don’t forget about costs: Stripe’s fees for billing, like 0.4% per paid invoice and up to 0.8% for advanced billing, add up quickly, so monitoring these is key to keeping costs down.
4. Customer Lifetime Value
Average customer lifespan estimates how long customers continue to pay. The repeat purchase ratio signals devoted customers who return time and again.
Customer analytics can divide your customers into cohorts by their spending over time. These insights help inform retention campaigns and loyalty programs.
Put this information to work, keeping your highest-value customers happy and reducing churn.
5. Net Revenue Flow
Net revenue retention indicates whether upsells and cross-sells compensate for losses due to churn or downgrades. Strong retention signifies a healthier business.
Cash flow, on the other hand, is more about monitoring money flowing in and out and is critical for day-to-day operations. MRR is a core metric for SaaS and subscriptions.
MRR makes income predictable, helping form solid budgets. Leverage these figures to inform pricing adjustments or experiment with new models.
Customer Growth Indicators

Customer growth metrics provide a transparent window into a business’s ability to acquire new users and retain them, particularly by analyzing customer churn rate and retention metrics. These important metrics assist in monitoring growth, identifying problems as they emerge, and demonstrating areas of concentration. Stripe users, particularly in SaaS or digital commerce, use these figures to verify whether their customer acquisition efforts, marketing, support, and product updates are effective.
Acquisition Cost
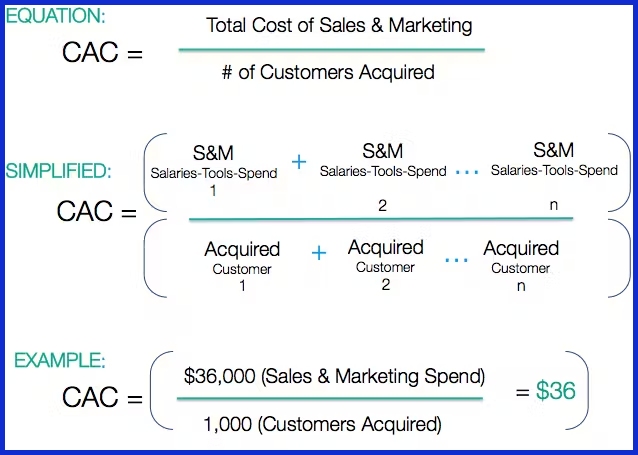
Customer acquisition cost (CAC) is the amount you spend to acquire each new user. That’s inclusive of marketing, ad spend, and sales commissions. CAC awareness lets teams budget and avoid blowing through it.
For instance, if CAC is increasing but revenue per user is level, it might suggest that ads or promotions are missing the appropriate audience. Comparing CAC across channels brings into focus which ones yield the strongest returns.
A social campaign may have less CAC than a paid search ad, but fewer long-term users. Teams can use this insight to shift budgets to channels with the optimal cost-quality mix. Low CAC and long user lifetime boost profit and sustain growth.
Retention Rate
Retention rate means how many users stick around. A high rate indicates both strong product fit and good support. Teams observe this figure to determine whether their welcome emails, subsequent follow-ups, or upgrade offers are making an impact.
Retention benchmarking before and after changes demonstrates what works. If users fall off following a new feature, it enables teams to correct defects quickly. Customer input goes a long way in increasing retention.
Surveys, reviews, and support tickets all lead to pain points. Acting on it can transform a transitory user into a loyal one. Monitoring these metrics over months or quarters allows teams to detect early warning signs of churn, so they can intervene with remedies before it impacts revenue.
Churn Dynamics

Churn rate monitors the proportion of users who depart within a given period. High churn makes it hard to grow because new users merely replace the lost ones. Stripe companies typically segment churn by product line, plan type, or customer segment.
This aids in identifying who is churning and the reasons. For instance, if churn is high for trial users but low in paid plans, your onboarding probably needs some work. Customer loss impacts revenue, and high churn can cause MRR to decline or plateau.
To address this, teams frequently break down churn by geography, age, or usage patterns. It directs action, such as targeted offers for threatened users or new support for particular cohorts.
Monitoring Total Customers
Monitoring raw user numbers indicates whether or not your business is making progress. Customer growth, combined with growing MRR or ARR, indicates the market values it. If the overall count is flat, it can indicate a highly competitive or weak product/market fit.
By observing trends, teams can anticipate when upgrades or new features may be necessary. It additionally assists in identifying dangers, such as an excess of revenue associated with a small number of large users.
Subscription Business Vitals
Subscription businesses require stable, regular revenue and impressive retention metrics. Stripe provides the vital signs necessary for monitoring fiscal well-being and identifying expansion potential, including customer engagement scores. Knowing what to measure, why it matters, and how to act on the results helps teams keep revenue steady and customer bases strong.
Recurring Revenue
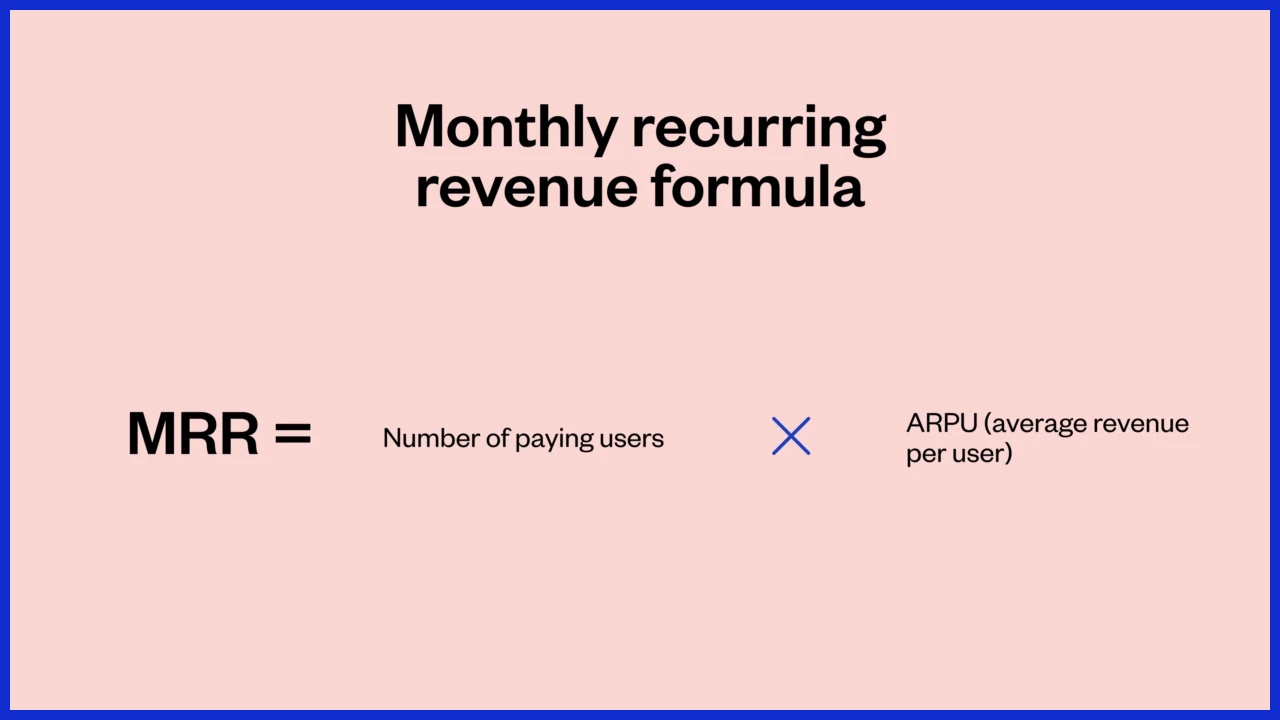
MRR, in the subscription model, is your backbone. MRR gives a good sense of consistent, recurring revenue. Stripe’s dashboards simplify MRR calculations, handy for agencies and SaaS teams seeking to budget for upcoming expenses or investments. A healthy subscription business gobbles up at least 90% of total revenue as recurring revenue because that just makes forecasting easier and lowers the risk associated with one-time sales.
Monitoring changes in recurring revenue over time brings trends and flags problems early. For instance, sustained MRR growth indicates either effective marketing or successful product adjustments. MRR declines can indicate churn or pricing issues. Recurring revenue by plan type can help you refine your pricing or bundle strategy.
Stripe analytics allow teams to understand how upgrades or downgrades impact total revenue, simplifying the process of testing new offers or tweaking service tiers.
Customer Stickiness
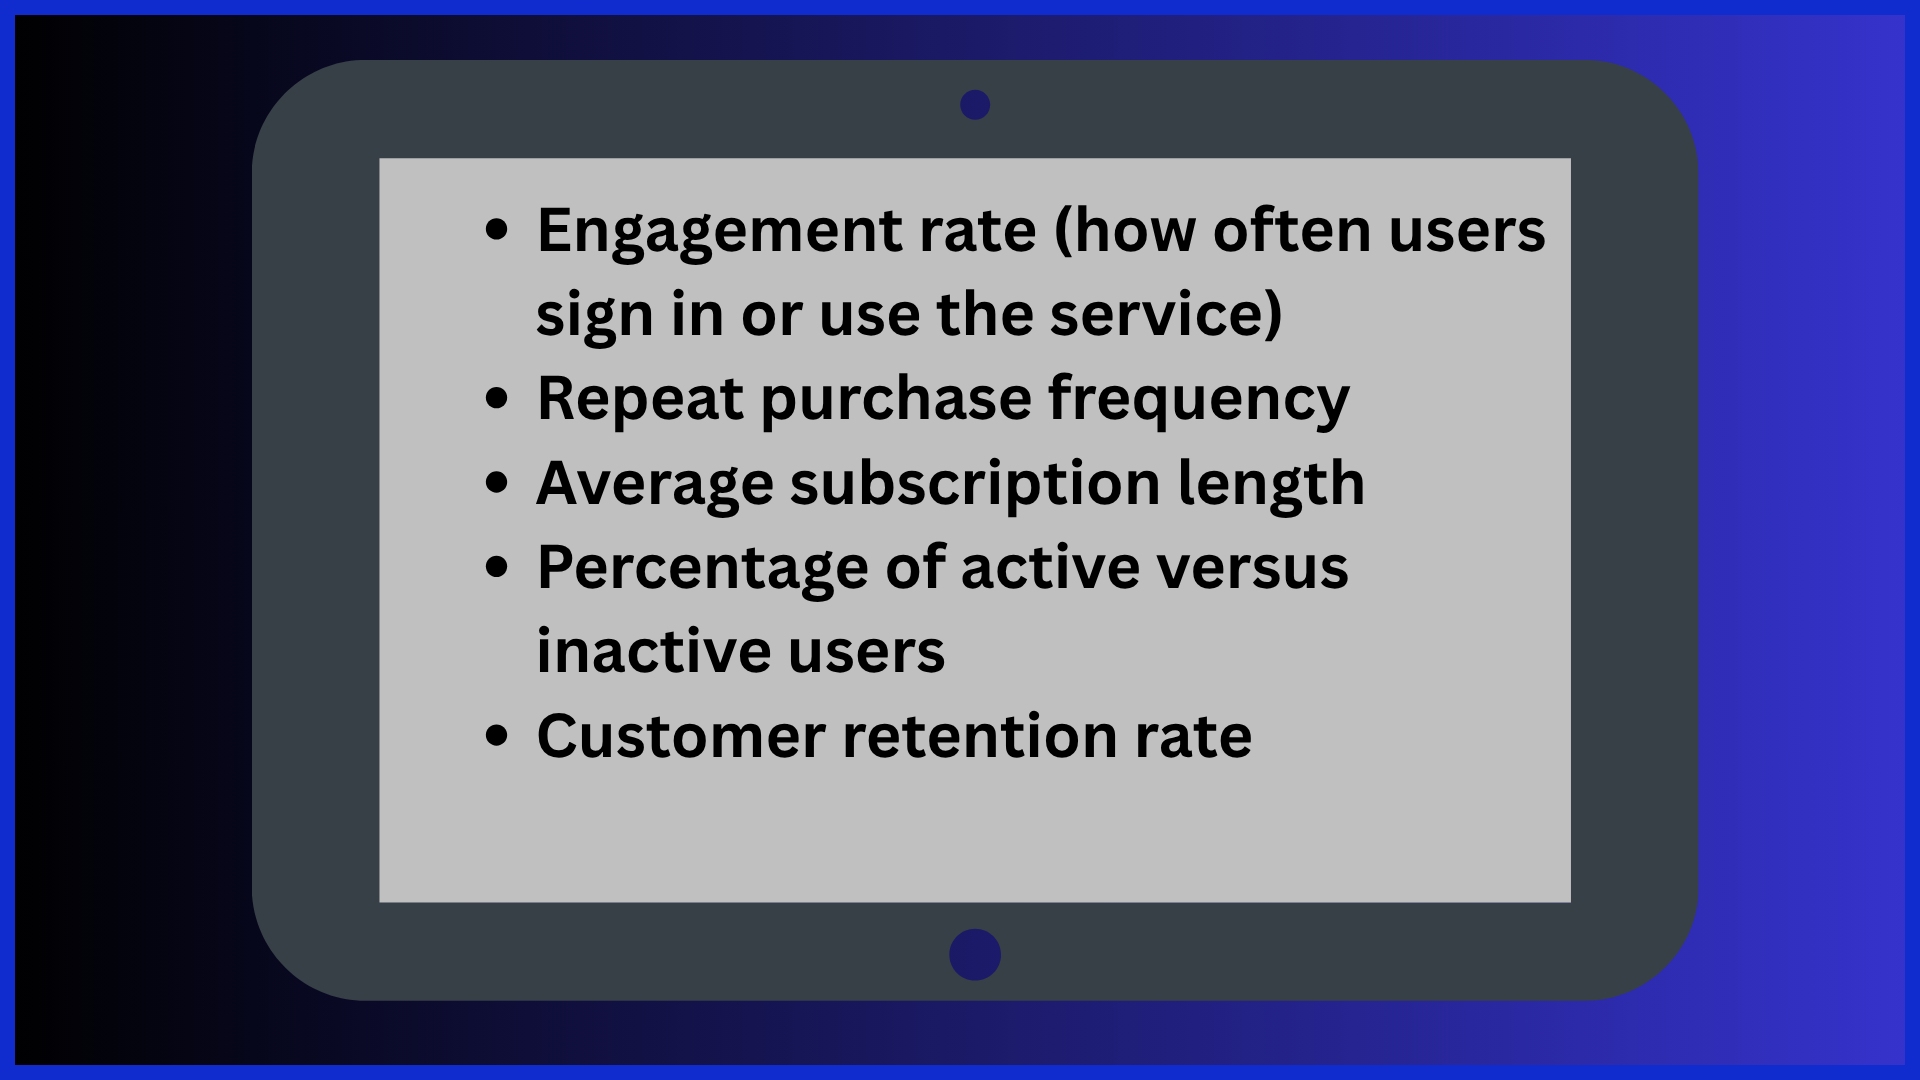
Services that have users coming more than once a week are 150% more likely to keep those subscribers through the next quarter. Research indicates that platforms with a 70% engagement rate experience approximately 12% greater revenue growth than those without.
Tracking interactions–app logins, feature use, support requests–identifies loyal customers and those about to abandon. To be sticky, you can add features that increase engagement, provide loyalty rewards, or customize content. Target 90%+ retention if you want to generate a sustainable growth trajectory.
Downgrade Impact

Downgrades eat away at MRR. By tracking the number and value of downgrades, businesses can see their real impact on cash flow. Stripe’s analytics, for example, demonstrate how various segments react to feature or pricing modifications.
Trends in downgrades can identify vulnerable cohorts requiring additional attention or improved onboarding. Customer input shows you why they downgrade—perhaps pricing, missing features or unclear value. If you know what these concerns are, helpful communication or targeted offers to address them can lower your downgrade rate over time.
Less than 5% is fantastic, but even 3% can really move the needle. Increasing retention rates by only 5% can increase profit margins by 25-95%.
Churn Metrics
Healthy businesses aim for a monthly revenue churn under 5%. Industry averages hover at about 5-7%. Reducing churn doesn’t just safeguard revenue — it drives up MRR.
Consistent churn analysis will surface the vulnerabilities in your onboarding, support, or pricing strategy. Predict churn with Stripe so you can act quickly to stop mass drop-offs.
Operational Efficiency Metrics
Operational efficiency metrics provide insight into how effectively a business operates daily. These metrics assist teams identify bottlenecks, eliminating waste, and improving service. For Stripe users, these metrics are helpful for monitoring payments, refunds, and dispute resolution, which all impact expenses and customer experience.
With insight and application of these figures, companies can increase efficiency, streamline processes, and retain customers.
Payment Disputes
Dispute rates indicate how frequently customers dispute charges. A sharp increase in disagreements can indicate issues with payment processes or ambiguous billing.
Digging into why disputes occur helps address root causes. Typical causes are fraudulent claims, billing errors or expectations being unfulfilled. Segmenting conflicts by category can highlight which offerings require revision and where client interaction fails.
This knowledge translates into improved training, billing clarity, and process updates, which all keep disputes to a minimum.
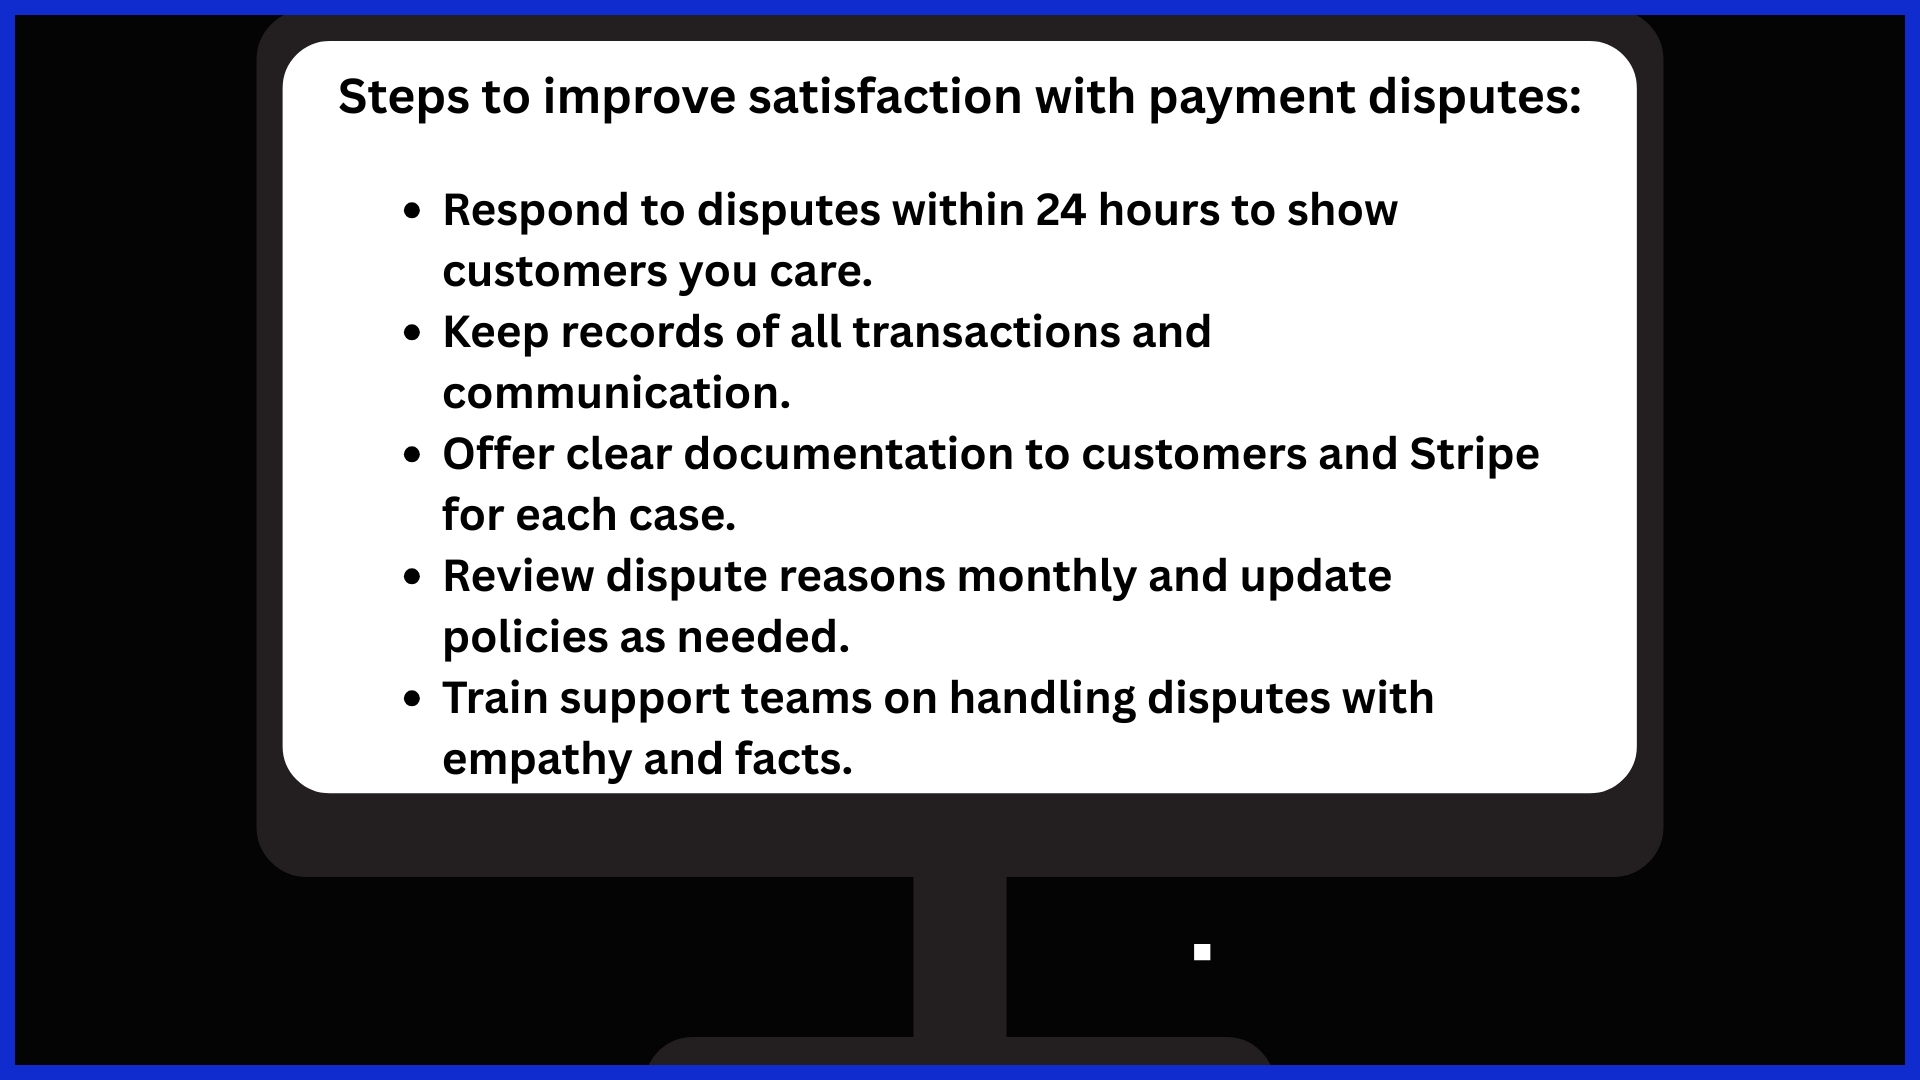
Measuring the speed at which issues are closed indicates your team’s effectiveness at issue management. Speedier resolutions equate to less cash stuck in the process and more satisfied customers.
Refund Patterns
Refund rates point out how frequently customers are displeased. A high rate could indicate product quality problems, deceptive marketing, or inadequate onboarding.
When refunds spike, revenue hits, and cash flow lags. By associating refund information with product lines or sales channels, teams can visualize where problems begin. This simplifies targeting improvements.
Examining refund trends assists in keeping products/services current with customer demands. It includes tweaks to return policies and support scripts to minimize refund requests.
If you don’t forget about your customers after the sale—say, by sending follow-up emails or offering support—you can reduce refund rates. Fast, personable answers to inquiries stave off demands to begin with.
Recovery Speed
Recovery speed quantifies the amount of time it takes to resolve payment problems. It includes both disputes and refunds. Slow recoveries equate to idle cash and annoyed customers.
This operational efficiency metric connects directly to cash flow and customer confidence. Time to recover funds reveals whether your team is working at optimal efficiency.
If it takes too long, drill into whether the problem is in Stripe’s process, your own systems or team training. Establishing benchmarks and tracking against them detects decelerations before they turn into major issues.
Teams can accelerate recovery by automating notifications, employing templates for common issues, and training staff on rapid resolution. Faster recoveries keep cash flowing and customers happy.
By focusing on recovery metrics, it illuminates which teams or steps require the most additional support. They help to set achievable targets for future gains.
Operational Optimization
Contrast measures such as order completion time, throughput, and utilization across teams. Identifying differences can expose best practices or bottlenecks.
Leverage this information to establish targets and verify advancement. Make small changes regularly for consistent gains.
Beyond the Dashboard
Stripe financial metrics transcend simple charts and figures. To really understand these metrics, including customer engagement metrics and retention metrics, is to see the human stories behind the data, to dig into the why behind the numbers, and to connect insights to actual business activity. This approach can assist businesses in identifying trends, addressing customer issues, and generating value for all participants.
The Human Story

Customer success stories demonstrate how Stripe’s payment solutions enable businesses to scale. For instance, a tiny web store in Berlin could easily leverage Stripe and swiftly extend across Europe. Measuring not only income, but also customer retention and upsell rates, can demonstrate why their method succeeds.
Customer feedback, both good and bad, provides hints about where users get stuck or what they love most. If multiple customers report failed payments, that’s an indicator to test the checkout. Qualitative data from surveys or interviews fills in holes that the numbers alone can’t penetrate.
Businesses can employ both types of data — numbers and stories — to gain a full picture. For example, if payment volume is up but support tickets are increasing, it’s worth exploring the reasons. Mashup Stripe’s transaction data with social comments or help desk logs, and you’ll know what’s working and what’s got to go.
Creating loyalty is about more than just tracking churn. Whether it’s checking in regularly by talking to high-value customers, dropping after-milestone satisfaction polls, or following up on lingering complaints, maintaining the relationship reminds customers they matter. This can increase retention and fuel referrals.
The Strategic “Why”
Metrics only matter if they tie back to business goals. For example, it’s logical to track metrics such as average revenue per user or lifetime value if those figures will feed into a plan to scale predictable revenue.
Revenue metrics help steer decisions around where to deploy, when to invest, or what to address first. A spike in failed payments could mean it’s time to streamline billing processes. Operational efficiency, monitored with Stripe’s dashboards, can identify where workflows bottleneck and where expenses accumulate.
Robust metrics support the tale for investors. Transparent, precise information about your recurring revenue, successful payments, and customer growth can help sway investors or soothe partners. It’s simpler to generate buy-in around new initiatives when everyone can see how the figures underpin the proposal.
Data decision making must be part of the team ethos. When everyone, from finance to customer support, can access insights and see their role in the bigger picture, the business runs smoothly. Operational silos crumble, and decisions are made more quickly and with greater confidence.
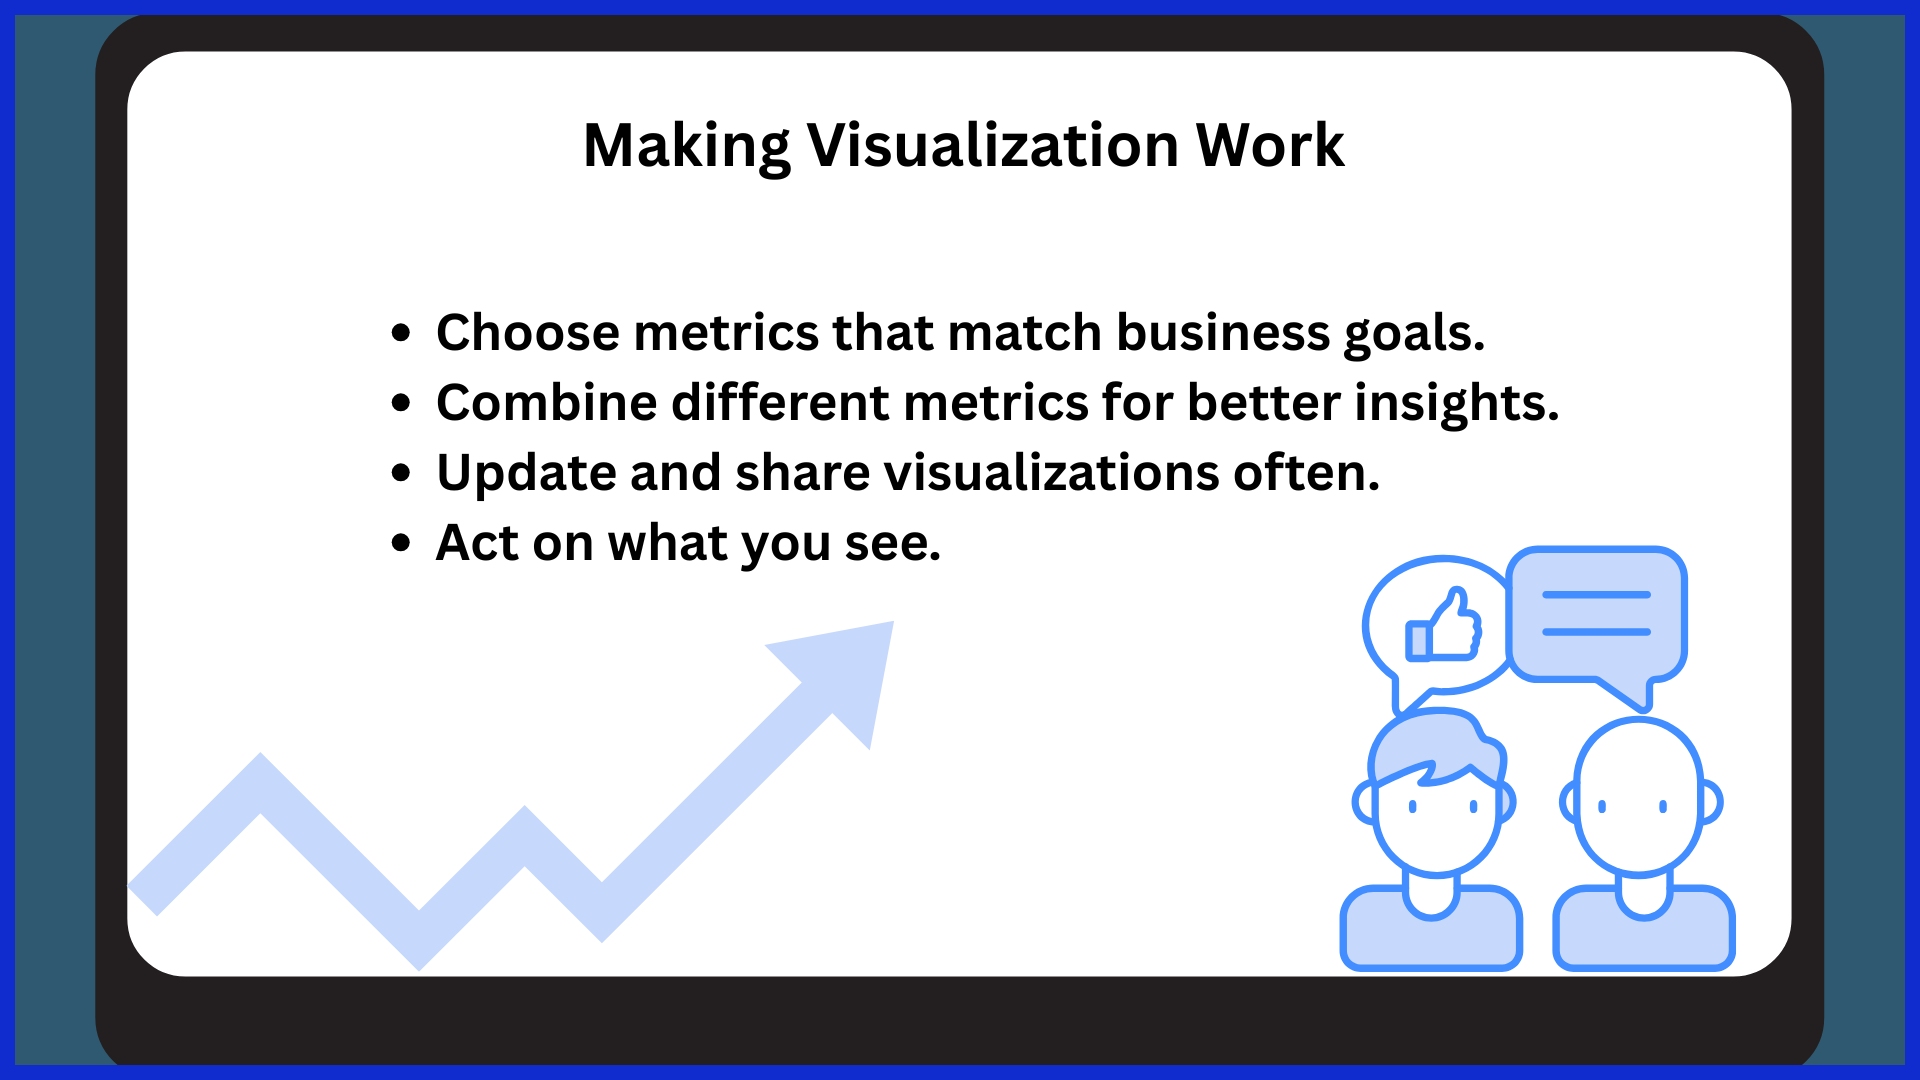
How to Visualize Metrics
Gaining visibility into Stripe financial metrics encompasses more than just observing figures. It’s about translating raw metrics into something people can comprehend immediately. Selecting an appropriate technique simplifies associating metrics with objectives, identifying patterns, and detecting issues.
The table below summarizes popular visualization techniques, their key advantages and typical tools.
| Method | Advantages | Tools |
|---|---|---|
| Spreadsheet Reports | Simple setup, flexible, easy sharing | Excel, Google Sheets |
| BI Tool Dashboards | Real-time, interactive, customizable | Power BI, Tableau, KPI.me |
| Charts & Graphs | Quick trends, visual clarity | Google Charts, Datawrapper |
| Custom Reports | Tailored to needs, stakeholder-focused | KPI.me, Looker Studio |
Spreadsheet Reports
Spreadsheets visualize Stripe metrics. They’re agile for rapid shifts and can accommodate new demands without a headache.
With pre-loaded formulas, you can automate key Stripe calculations, such as net revenue, take-rate, or seller acquisition costs. This reduces time and eliminates mistakes.
Nothing is more helpful than bar charts or line graphs to immediately highlight trends in CLTV or active users and recognize shifts in user behavior or revenue flow. File-sharing with coworkers makes collaboration more efficient and enables quicker decisions, particularly when you’re all viewing and discussing the same live data.
BI Tool Dashboards
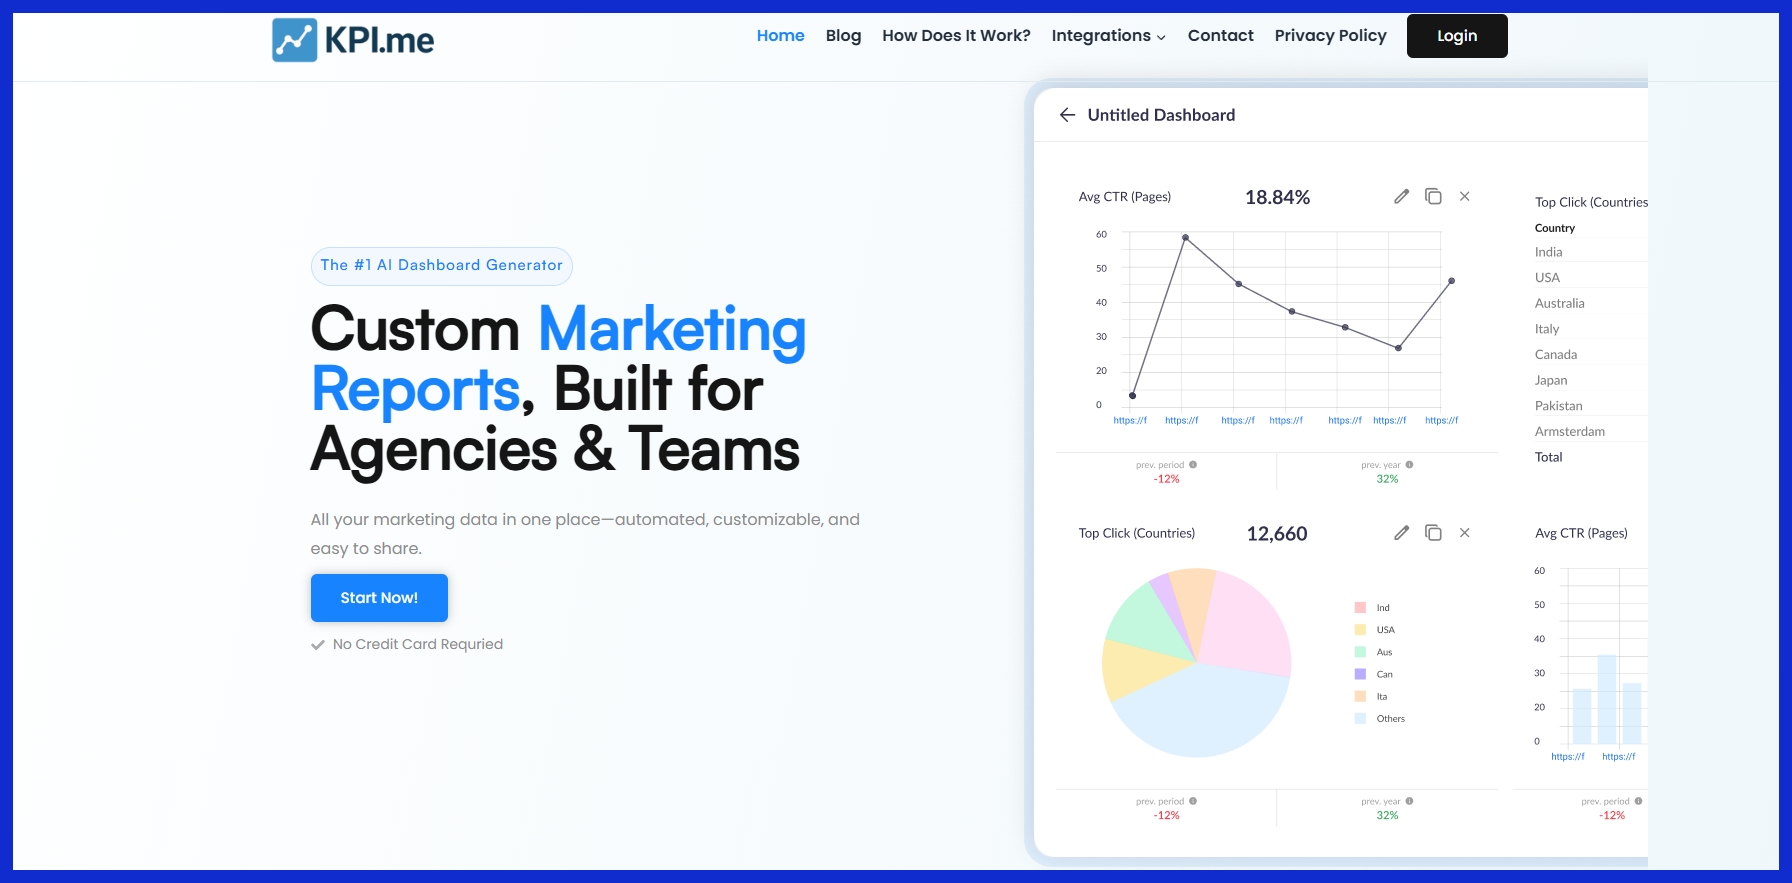
Dashboards constructed with BI tools provide teams a real-time window into performance. They can follow order fulfillment velocity, net revenue, and other Stripe metrics as events happen.
These dashboards can be customized to only display metrics that align with business goals and priorities, preventing data overload. With features like filters, drill-down views, and real-time charts, users can dig into the data to detect patterns, including bottlenecks in payment flow or spikes in acquisition costs.
BI tools accelerate reporting, so updates get to stakeholders quickly. This simplifies identifying bottlenecks and optimizing performance. Dashboards are great for continuous tracking, but make sure you use them as a feature of a larger, coherent analysis.
Following metrics piecemeal invites false conclusions. Mixing metrics, like considering take-rate with CLTV, provides a better sense of how shifts impact business results.
Customizing Visual Reports
Custom reports suit various stakeholders’ needs by emphasizing the most pertinent metrics. Marketing teams might concentrate on CLTV and user acquisition, while finance teams observe net revenue and take-rate patterns.
Custom visualizations, like cohort or funnel graphs, can indicate where users fall off or where profit leaks. This helps leaders decide where to invest or tweak their strategy. Custom reports allow each group to more easily take action on data that matters to them.
Conclusion
Stripe provides teams a transparent view into what’s most important—revenue, churn, and retention. Monitor churn, observe monthly recurring revenue, and see how quickly you collect payment. Discover where visitors bounce or convert. With easy-to-understand charts, you can identify trends and highlight what works. No deep dives or tech-speak. Even small teams receive rapid responses that assist in making decisions.
These metrics pierce through the static and help you act with precision. To accelerate your report workflow, check out solutions like KPI.me for one place to view your Stripe data—readable, shareable. Go with the fundamentals, pick what works for your crew, and keep on truckin’.
Frequently Asked Questions
What are the most important Stripe financial metrics to track?
The key Stripe financial metrics include revenue, monthly recurring revenue (MRR), customer churn rate, customer lifetime value (CLV), and average revenue per user (ARPU).
How can Stripe metrics help improve business performance?
Top-line metrics, such as retention metrics and customer churn rate, help identify what’s driving growth, what’s driving churn, and how to optimize pricing for better decision-making.
Why is customer growth an essential indicator for Stripe users?
Customer growth indicates how rapidly new customers come on board, impacting customer acquisition efforts and overall performance. It is crucial for companies to know their reach and direct marketing, and product strategies.
What is churn rate, and why does it matter?
Churn rate measures the number of customers who depart within a specific timeframe. A high customer churn rate indicates something might be wrong with your product or the way customers engage with it.
How can I visualize Stripe financial metrics effectively?
Show data with dashboards, charts, and graphs to enhance customer engagement metrics. Visualization enables you to identify trends and make decisions quickly.
What operational efficiency metrics should Stripe users monitor?
Track important metrics such as transaction success rate and payment failure rate to evaluate your e-commerce performance and payment processing platforms.
How does subscription data from Stripe support business decisions?
Subscription metrics, including customer churn rate and retention metrics, show renewals, upgrades, downgrades, and cancellations, allowing companies to customize products and increase loyalty.