12 Customer Retention Metrics You Should Track & How to Calculate Them
Key Takeaways
-
Customer retention metrics help lay the foundation for predicting revenue, business planning, and finding reliable revenue streams.
-
Retention-centric growth is sustainable growth. It drives up customer lifetime value and minimizes expensive acquisition.
-
By monitoring loyalty and engagement metrics, businesses can customize their marketing strategies, enhance customer experiences, and cultivate brand advocacy.
-
Customer retention metrics help businesses collect and analyze product feedback so they can see where their products could be improved and fix customer pain points.
-
Segmenting your customers and testing retention strategies can help personalize your approach and optimize retention results for different segments.
-
A mix of retention numbers and customer stories or feedback is a great way to cover your bases.
Customer retention metrics are figures that capture how well a company retains its customers.
These metrics enable teams to identify patterns, monitor customer loyalty, and determine strategies that encourage repeat business.
Good retention rates tend to indicate excellent service, high-quality products, and satisfied customers.
Many brands take these figures and use them to inform strategies, establish targets, and quantify sustainable growth.
The following section describes important metrics and how to apply them in actual plans.
Why Retention Metrics Matter

They provide visibility into who sticks around and for how long. These figures assist in identifying the areas in which you are strong and those in which you lose clients. If your retention is high, then your users are likely satisfied — a fact that can correlate to increased sales, positive ratings, and organic growth.
It is less expensive to keep a customer than it is to gain a new one, and with the right metrics, teams can make intelligent decisions for sustainable success.
1. Predictable Revenue
Tracking how many customers you retain helps you forecast future revenue more accurately. It makes budgeting, goal-setting, and scaling much easier because you can spot loyalty dips early and adjust quickly.
2. Sustainable Growth
Growth is more stable when you keep existing customers instead of constantly finding new ones. Good retention boosts profits and customer lifetime value without extra ad spend.
3. Brand Advocacy
The longer your customers stick around, the more likely they are to spread the word about you. Tracking things like NPS demonstrates how eager people are to spread the word about your product.
4. Product Feedback
Retention metrics reveal what draws customers back and what pushes them out. Periodic surveys and churn analysis assist in detecting problems early, whether it is a confusing feature or a sluggish support team.
5. Reduced Costs
Retention is important because it’s almost always less expensive to keep a customer than to acquire a new one. By monitoring critical retention KPIs, such as repeat purchase or average contract length, you can see which strategies are most effective.
Essential Customer Retention Metrics

Customer retention metrics assist teams in identifying what approaches retain users, generate repeat sales, and fuel business growth. By monitoring the right metrics, you can identify trends, address vulnerabilities, and strategize for improved performance.
These metrics transcend industries and markets, providing a transparent view of actual performance and where to take action next.
Below are the 12 essential customer retention metrics every business should track, and how to calculate, interpret, and apply them in real-world scenarios.
1. Customer Retention Rate (CRR)
What it measures:
The percentage of customers a company retains over a given time.

Why it matters: CRR is the cornerstone of all retention analysis. It shows how effective your business is at keeping customers over time.
Example:
If a SaaS company starts the quarter with 1,000 customers, gains 200 new ones, and ends with 1,050, its CRR is:
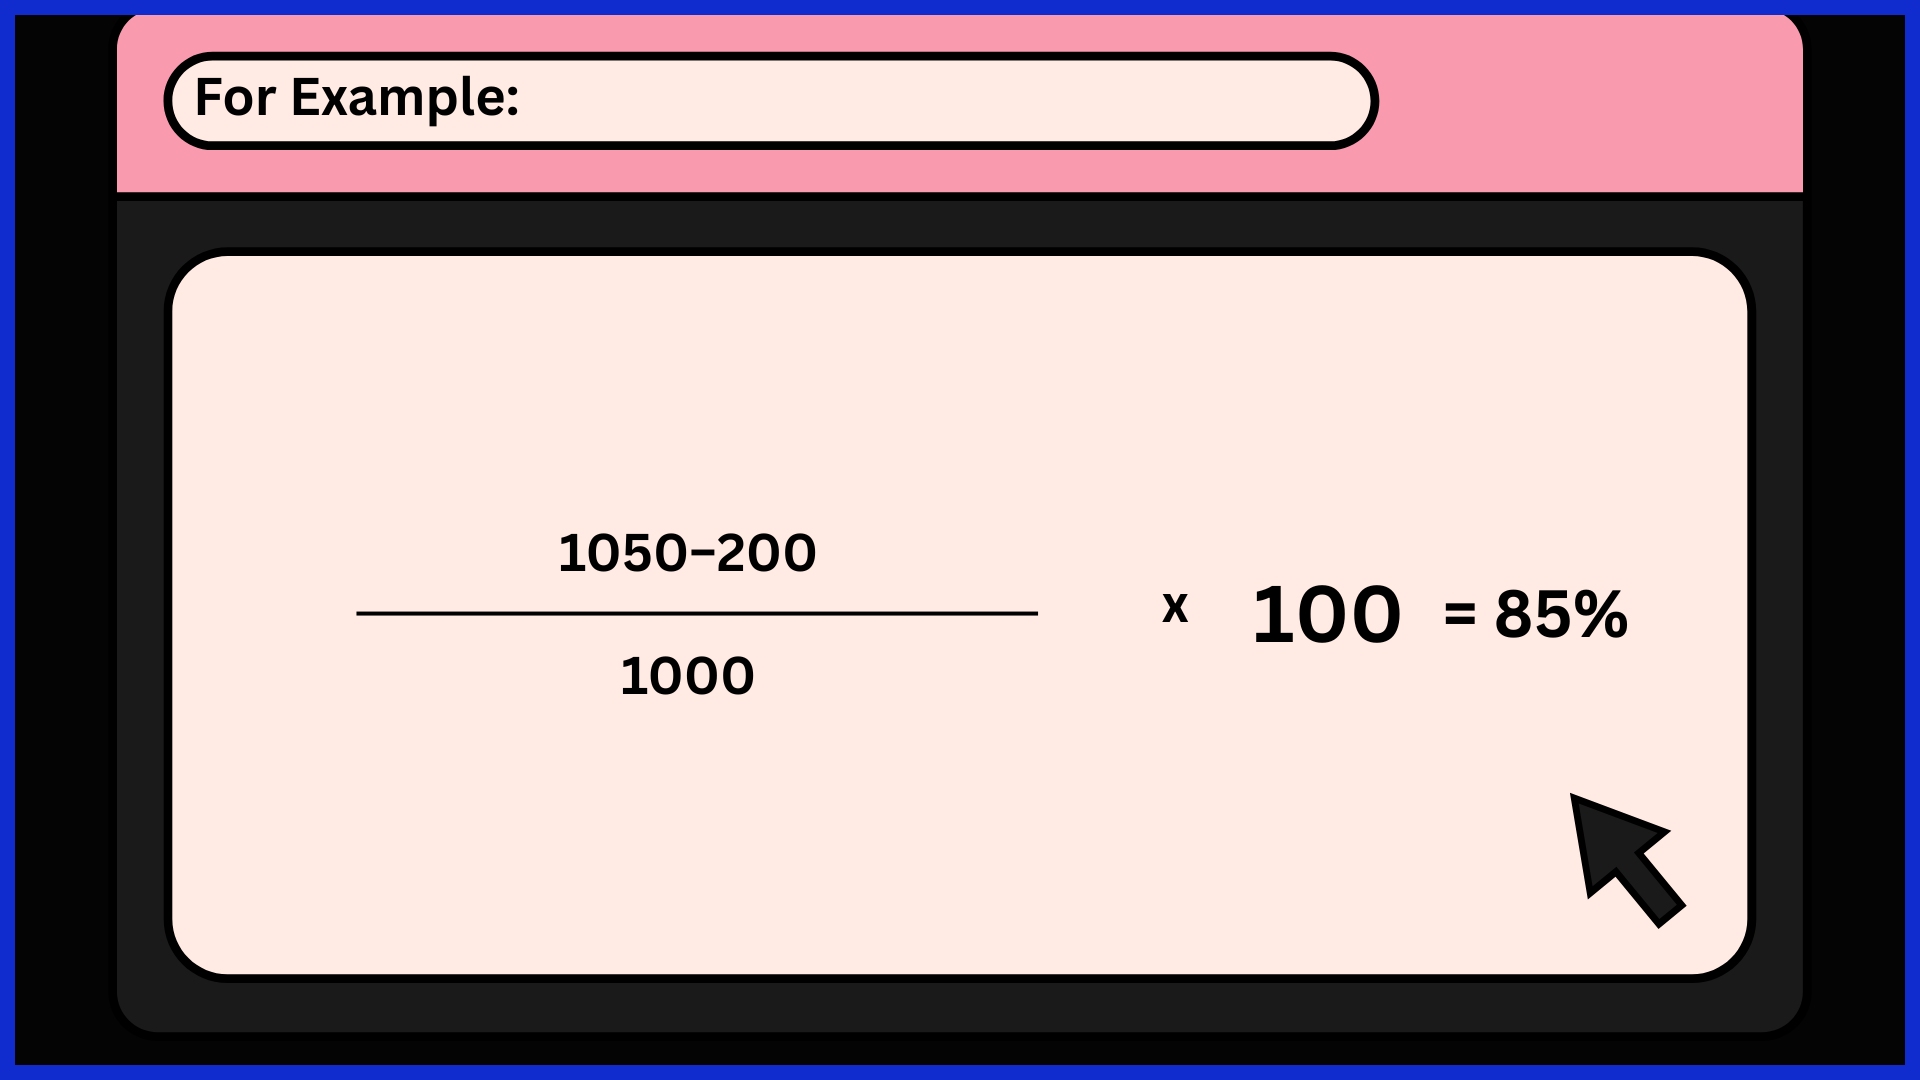
That means the company retained 85% of its existing base.
2. Customer Churn Rate (CCR)
What it measures: The percentage of customers who stop using your product or service during a period.

Why it matters:
It’s the inverse of retention. A high churn rate means poor customer satisfaction or a weak onboarding process.
Example: If 100 out of 1,000 customers cancel their subscription in a month, the churn rate is 10%.
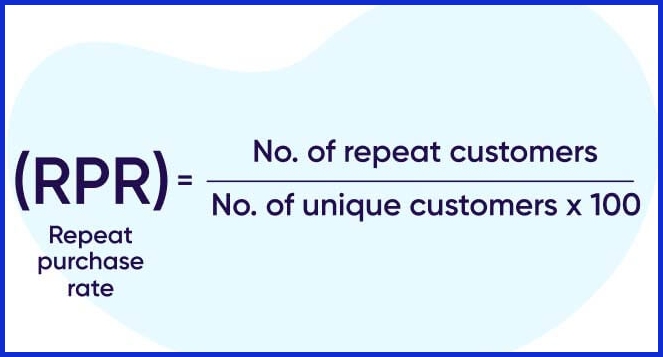
3. Repeat Purchase Rate (RPR)
What it measures:
The proportion of customers who make more than one purchase.

Why it matters: This metric indicates customer loyalty and how often buyers return for more.
Example: An online skincare brand finds that 300 of 1,000 customers placed a second order — a 30% repeat purchase rate. That’s a healthy indicator of satisfaction.
4. Customer Lifetime Value (CLV or LTV)
What it measures:
The total revenue you can expect from one customer throughout their relationship with your brand.
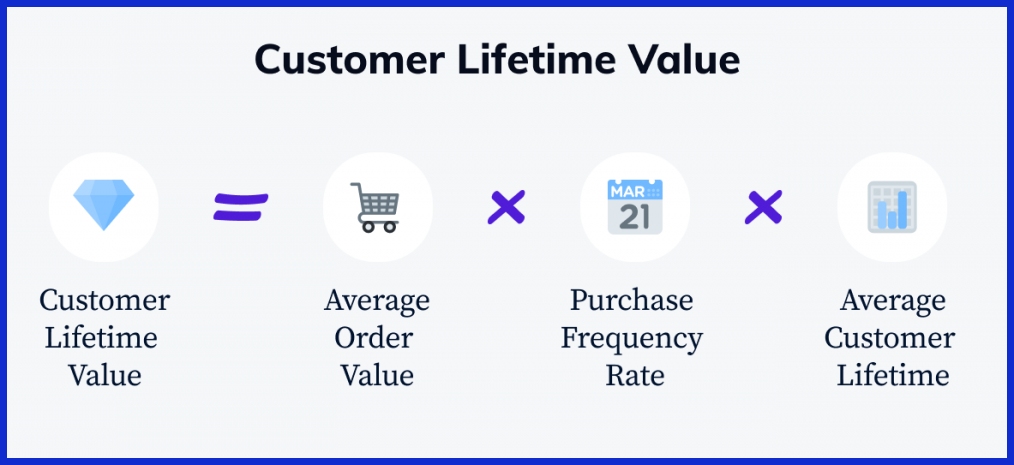
Why it matters: CLV helps businesses understand how much they can spend on acquisition and retention while staying profitable.
Example: A SaaS company charges $20/month, and the average customer stays for 24 months:
CLV = $20 × 24 = $480 per customer.
5. Net Promoter Score (NPS)
What it measures:
Customer willingness to recommend your product or service to others.
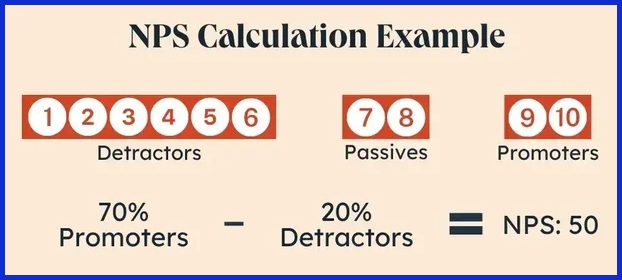
Why it matters: High NPS indicates brand loyalty and customer advocacy.
Example:
If 60% are promoters and 10% detractors, NPS = 50 — an excellent score indicating strong satisfaction.
6. Customer Satisfaction Score (CSAT)
What it measures:
How satisfied customers are with a product, service, or specific interaction.

Why it matters: It’s one of the simplest and fastest ways to gauge satisfaction after a touchpoint.
Example:
After a support call, 90 out of 100 users rate their experience positively — a 90% CSAT score.
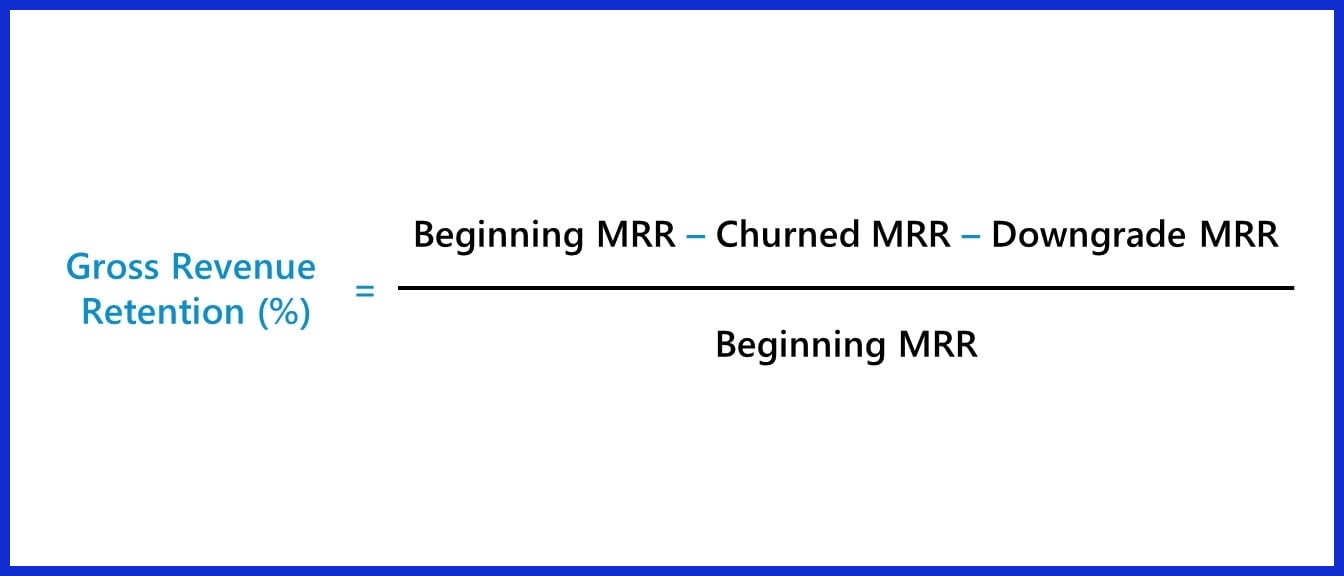
7. Revenue Retention Rate (Gross/Net Revenue Retention)
What it measures:
How much recurring revenue you retain from existing customers, including expansions and contractions.
Gross Revenue Retention (GRR):
Net Revenue Retention (NRR):
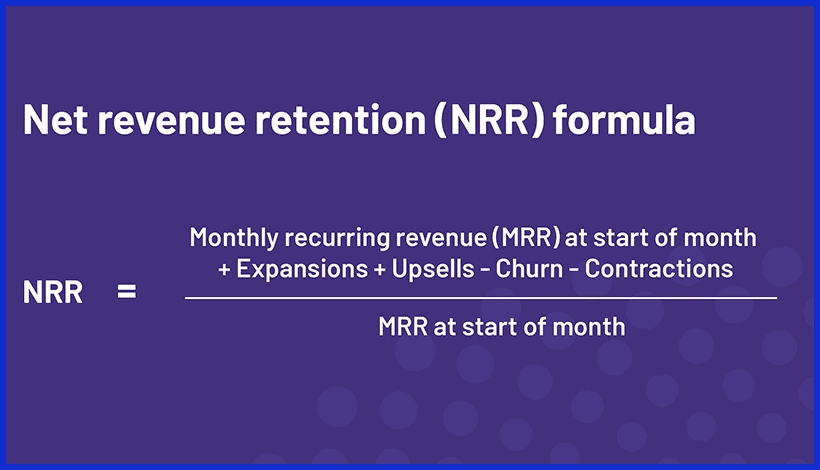
Why it matters: It shows whether your current customers are spending more or less over time.
Example: A company starts the month with $100,000 in recurring revenue, upsells $10,000, and loses $5,000 to churn.
NRR = (105,000 / 100,000) × 100 = 105% — meaning growth from the existing base.
8. Average Order Value (AOV)
What it measures:
The average amount spent per transaction.
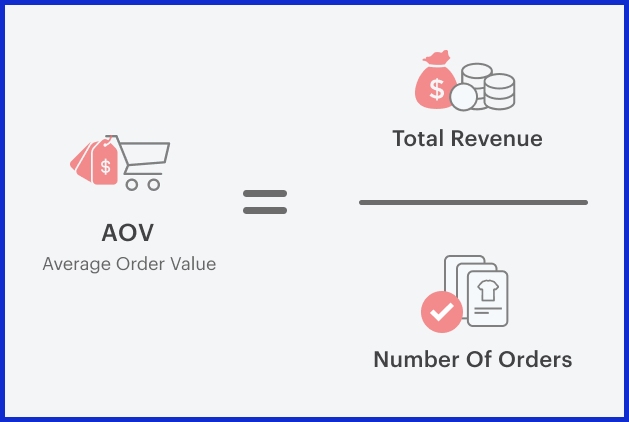
Why it matters: A higher AOV indicates customers trust your brand and are willing to spend more.
Example: If your store made $10,000 from 250 orders, AOV = $40.
9. Customer Engagement Score (CES)
What it measures: A composite score based on customer interactions — logins, clicks, feature usage, or time spent.
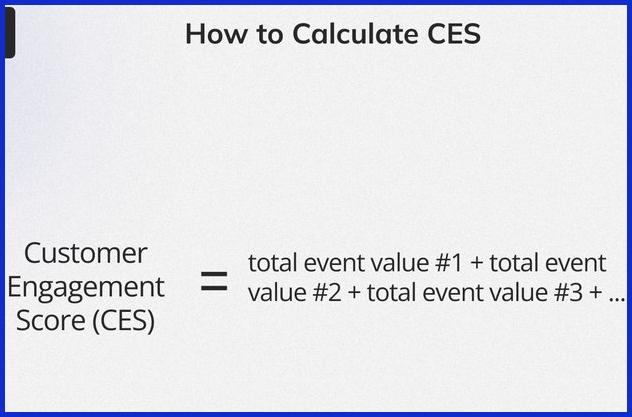
Why it matters: A high engagement score suggests healthy user activity and low churn risk.
Example: A SaaS platform might assign weights: logins (40%), feature use (30%), and time in app (30%). Users with CES above 70 are “highly engaged.”
10. Time Between Purchases (TBP)
What it measures:
The average number of days between two customer purchases.
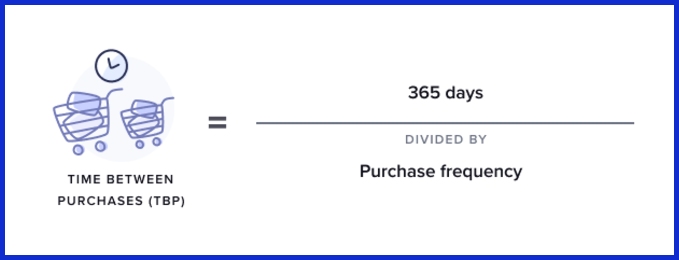
Why it matters: Shorter purchase gaps imply higher retention.
Example:
If coffee subscription users reorder every 25 days on average, a sudden jump to 40 days could signal slipping engagement.
11. Customer Loyalty Rate (CLR)
What it measures:
The percentage of customers who remain loyal (no churn + repeat purchase + advocacy) over time.
Why it matters: This metric captures emotional loyalty, not just transactional behavior.
Example:
If 500 of 2,000 customers renew, repurchase, and refer others, the loyalty rate is 25%.
12. Repeat Purchase Frequency (RPF)
What it measures:
How often customers buy within a set time frame.
Why it matters: It highlights how often users engage financially. Increasing purchase frequency boosts revenue without acquiring new customers.
Example: If 2,000 customers placed 5,000 orders in six months, RPF = 2.5.
From Data to Decisions
Retention metrics provide the teams with the data they need to identify trends, experiment with innovations, and implement actionable changes that cultivate loyalty. Observing these figures over time assists in noticing trends in customer behavior, providing early warnings or potential risks or successes.
Peeking at NRR and CLV-type metrics provides a more holistic insight into customer behavior. With cohort analysis, teams can compare groups over time, helping them determine if strategies are effective for certain kinds of customers. Historical data can reveal what is coming next, allowing you to plan accordingly.
Data to decisions keeps companies on track and growing, especially in industries where the currents flow fast.
Identify Trends
Separating out customers is fundamental. Segment with information such as age, location, purchase behavior and engagement frequency. Every group behaves differently, so treating everyone equally seldom succeeds.
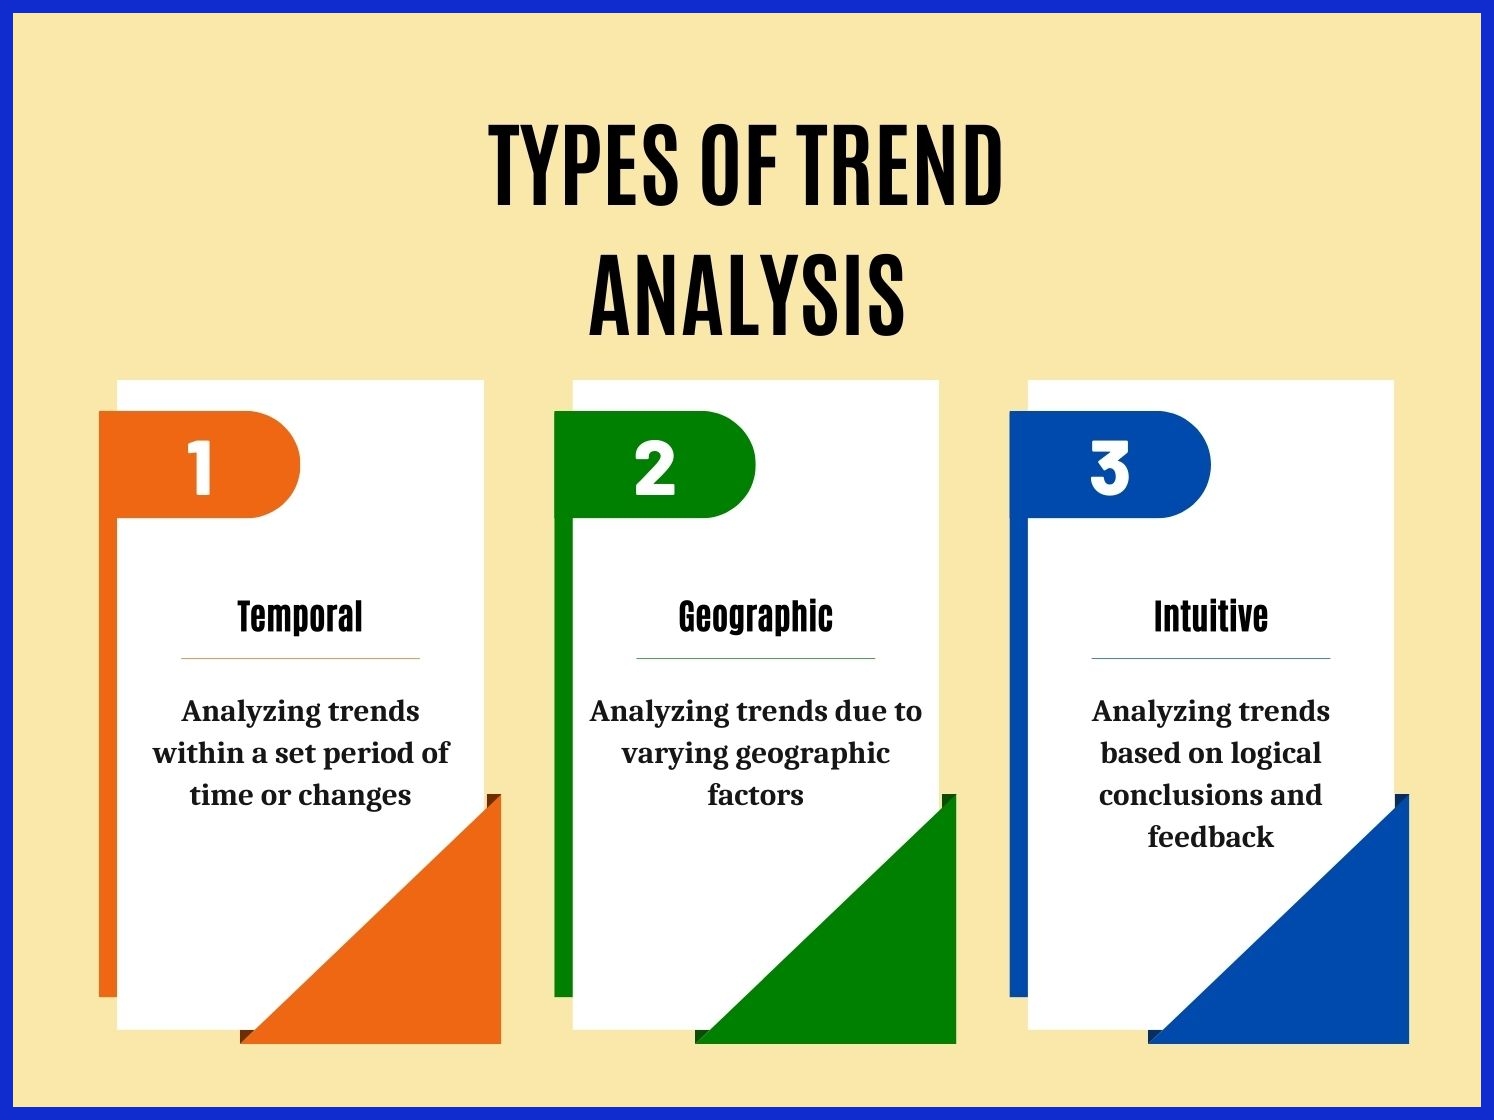
Once they’re grouped, it becomes easier to identify those who purchase more, stay longer, or require additional attention. For instance, a segment that consistently renews their service might react to loyalty incentives, whereas one with high churn will require new activation strategies.
NRR shows you which segments are value-add and which require care. To adjust marketing based on these insights is for teams to escape wasted effort. Personalized notes, such as product tips for active users and win-back offers for threatened ones, can increase engagement.
Historical retention data reveals when specific segments are going to churn, so companies can intervene in advance.
Segment Customers
Cohort analysis provides a vivid view of how various customer segments act as time goes on. For instance, holiday-sale customers might churn faster than ones coming off demos. By monitoring these patterns, teams are able to modify their approach to each audience.
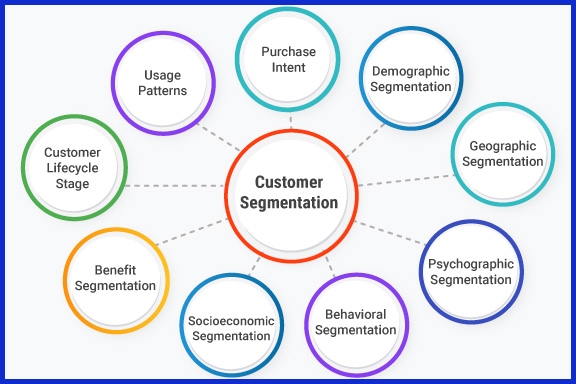
Some might want email reminders. Others might require improved onboarding. By comparing segments, teams can discover which customers are most valuable and which are slipping away.
Data visualization tools transform raw figures into crisp charts, allowing you to communicate insights and take action more effortlessly. Decisions about product changes or new campaigns become more focused and lead to better results.
Test Strategies
Testing new retention tactics is essential for consistent growth. A/B testing allows them to test two concepts, such as a fresh loyalty program versus additional assistance, and determine which is most effective. It keeps decisions grounded in real customer behavior, not guesses.
Taking feedback after each test informs new plans. If a new feature increases retention for a segment, teams can ramp up or expand it. Periodic reviews keep efforts fresh and tuned to what customers care about.
Experimentation is not a one-time deal. It’s a cycle: try, measure, learn, repeat. Companies that operate continuous experiments adjust more quickly and experience stronger destination returns.
Connect Metrics with Stories
Retention numbers report one half of the story. Customer feedback and success stories complete the picture. Hearing real stories brings to the forefront problems that you don’t detect in data, such as why a viral feature is important or what caused a user to churn.
Teams who mix data and narratives obtain a complete view. Win sharing internally keeps everyone energized around what works. Taking needle-moving trends together with customer language enables companies to plan boldly and with compassion.
Improving Retention Performance
Retention performance depends on the degree to which a business knows and meets customer needs at each point. Personalization, proactive support, and consistent feedback loops are critical in keeping customers engaged and satisfied. Leveraging defined KPIs such as onboarding milestones, cohort retention rates, and CSAT scores identifies areas of focus.
Customer segmentation allows interactions and support strategies to be personalized to make customers feel valued.
Personalize Experiences
Companies that personalize customer experiences based on preferences and activity develop greater engagement. By examining transaction data, session frequency, or feature use, teams can identify at-risk users, such as those with low feature use or low CSAT scores, and proactively engage with targeted assistance.
Personalized marketing campaigns that leverage purchase history or browsing patterns can suggest relevant products or services, making every message feel more significant. Needs anticipation is central to this method.
For instance, when onboarding programs shepherd new users to their initial ’aha’ moment, measured by onboarding completion and early activation rates, long term retention can be improved. Self-service options like FAQs or chatbots enable customers to resolve straightforward problems on their own, minimizing friction.
Teaching customer service teams empathy and flexibility builds loyalty, with 73% of leaders associating customer service abilities with retention and business performance.
Proactive Support
Proactive support is fixing something before it breaks. Giving these at-risk users to your customer success teams for early outreach will stave off churn. Even if the final answer takes longer, fast responses to customer inquiries demonstrate that concerns are being heard, which boosts satisfaction.
Smooth customer journeys are a must. By smoothing out each interaction, from onboarding through support, companies design a seamless experience that promotes ongoing engagement. Periodically examining data like days between transactions or feature adoption rates enables you to identify risky drop-off moments, allowing you to time support where it’s most effective.
Feedback Loops
Gathering customer feedback through surveys and interviews on a regular basis provides good insight into satisfaction and expectation. When you compare this feedback with quantitative retention data, it surfaces trends and uncovers hidden pain points.
For instance, cohort retention analysis displayed as tables or charts can reveal if engagement falls off after week one, suggesting a mid-funnel problem. We should be suspicious of a one-dimensional measure.
CSAT, cohort retention, and behavioral data combined give you a complete picture of the customer journey. Any insights gained should be tied back to business objectives so that retention efforts generate significant growth.
Conclusion
Good retention metrics reveal real patterns, not just numbers. Metrics such as repeat rate, churn, and lifetime value reveal what retains customers. Teams can detect declines quickly, detect successes, and demonstrate definitive evidence of what is effective. Numbers do not spin yarns on their own. Defined objectives, wide attention, and regular auditing keep your retention metrics on course. Do not fall into the trap of over-interpreting a single spike or dip. Search for true trends, not manic swings. To fill in the details, incorporate direct input from actual users.
User-friendly reporting platforms such as KPI.me are a great way to keep all your data in one place. Do you desire to retain additional users? Start with defined retention measures and extend from that.
Frequently Asked Questions
What are customer retention metrics?
Customer retention metrics gauge how effectively you retain your customers. They measure repeat buying, customer loyalty, and customer satisfaction, providing businesses with insights into how to maintain and grow those relationships.
Why are customer retention metrics important?
Such metrics assist businesses in identifying customer relationship strengths and weaknesses. By tracking retention, businesses can lower expenses, improve top-line growth, and create a devoted following.
Which customer retention metrics should I track?
Important metrics are retention rate, churn rate, repeat purchase rate, customer lifetime value, and net promoter score. Tracking these helps you identify where to increase customer retention.
How can customer retention metrics guide business decisions?
Retention metrics are instructive. With such trend analyses, businesses can adapt strategies, optimize experiences, and target efforts that generate long-term engagement.
What are common pitfalls when interpreting retention metrics?
Misreading data, discounting external forces, or a sole focus on short-term results are common traps. Look for trends over time and consider everything going into it.
How can I improve my customer retention rates?
Listen to customers, customize messaging, incentivize repeat business, and rapidly resolve complaints. If you do that, your customers will come back.
What is the difference between retention rate and churn rate?
Retention rate tells you the percentage of customers who remain with you, and churn rate tells you the percentage who abandon you. Both metrics together deliver a complete view of customer loyalty.

