Top Digital Marketing Reporting Tools for Smarter, Faster Insights
Key Takeaways
- Digital marketing reporting tools provide straightforward and actionable insights. They enable marketers to monitor campaign performance and gain actionable insights needed to make smart decisions in today’s dynamic, competitive U.S. marketplace.
- Advanced reporting platforms offer powerful benefits compared to simple reporting in a spreadsheet. They’re built to work with complex datasets and easily bring data together from disparate sources.
- Focusing on actionable KPIs and aligning metrics with business objectives ensures that marketing efforts deliver measurable results and support strategic goals.
- Real-time reporting tools and customizable dashboards increase agility. They enable teams to spend less time chasing reports and more time adapting to shifting market conditions and campaign performance.
- The most important things to consider when selecting a reporting tool are. Consider elements like data compatibility, user interface, scalability, pricing, and data security to make sure the software can address your unique business requirements.
- Keeping ahead of trends such as AI-driven analytics and advanced data visualization. Adopt privacy-first solutions to make sure your marketing strategies continue to succeed while adhering to developing best practices and regulations!
Digital marketing reporting tools allow teams to manage vast, complex sets of marketing data across multiple channels. Sorting all these numbers can become overwhelming, and drawing actionable insights can require a lot of time.
Smart reporting tools structure data, reduce clutter, and help you view the results of your campaigns at a glance. In this post, we’re breaking down the best tools on the market.
What Are Reporting Tools?
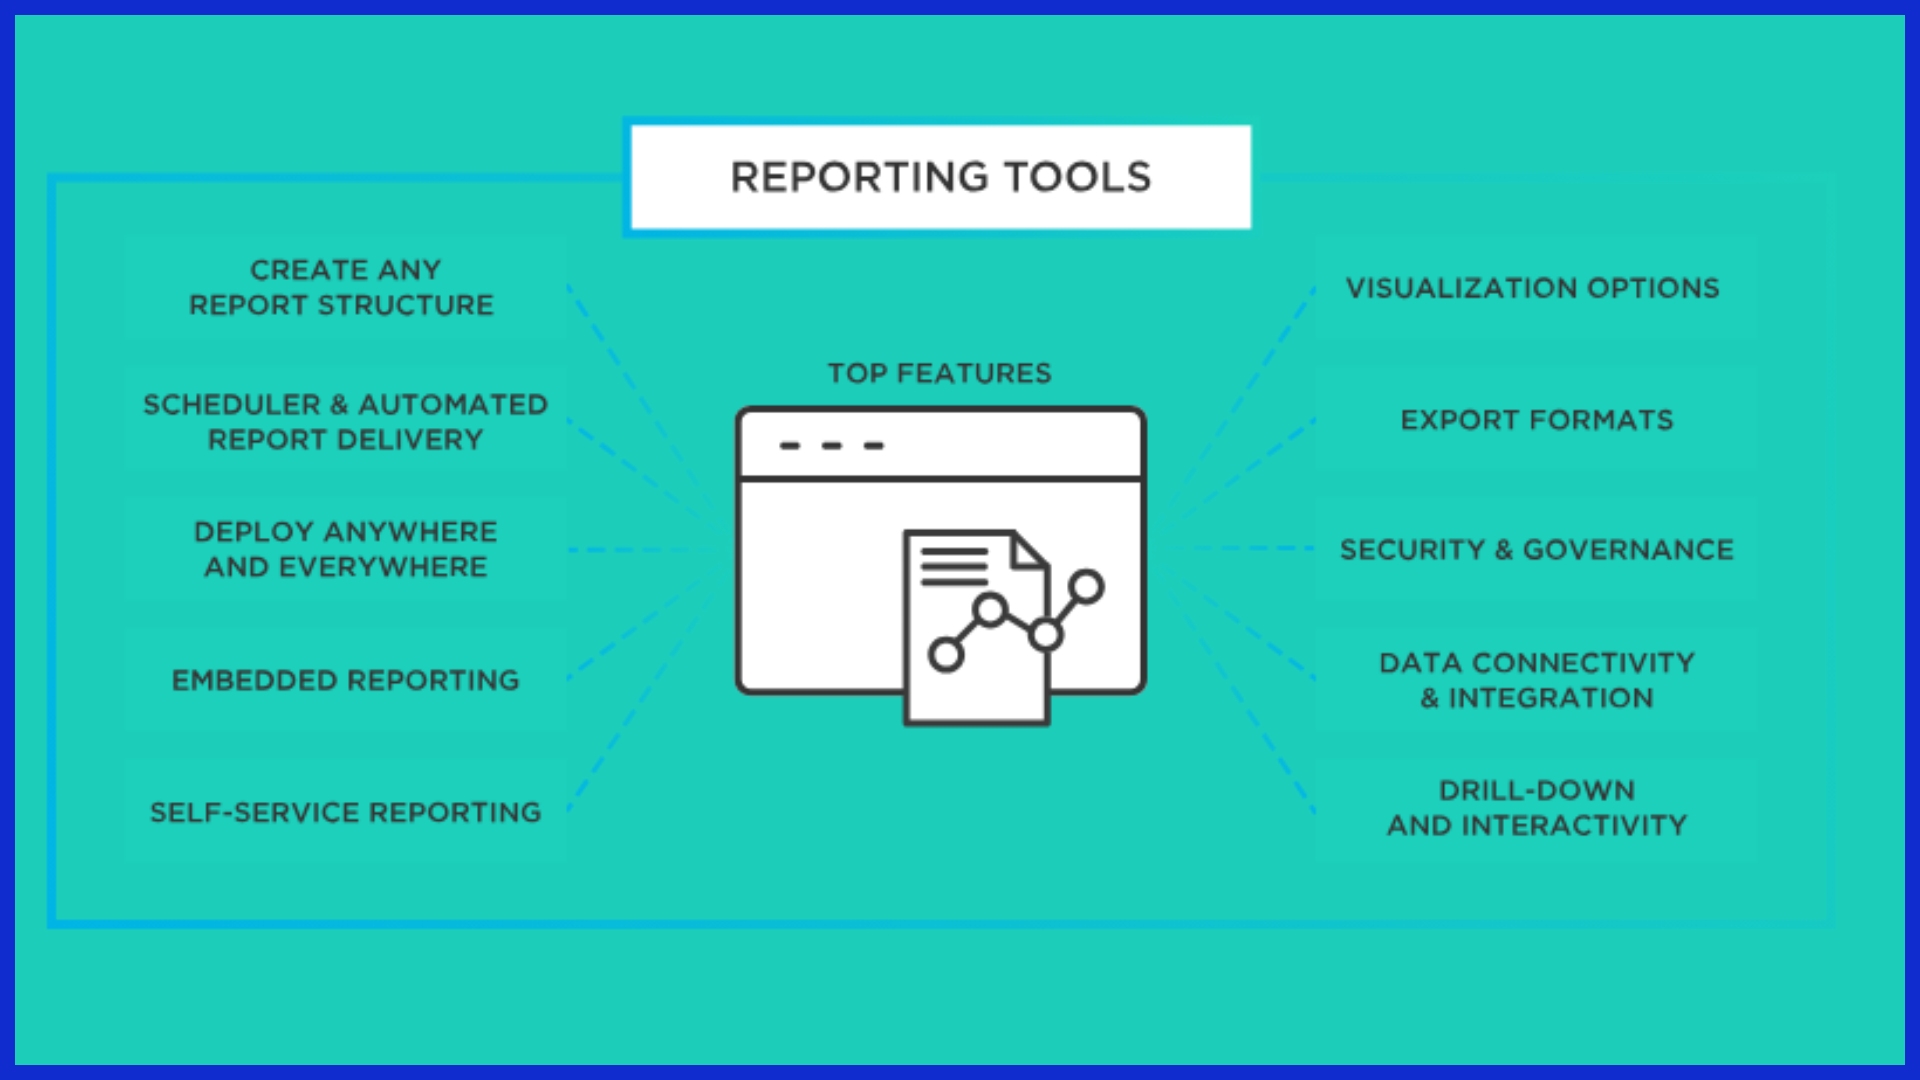
Reporting tools are software designed to help marketing teams easily track, analyze, and share data. In the world of digital marketing, reporting tools are essential. They provide insights into what’s working and what’s not, what you need to adjust, and where you should focus your budget for maximum effect.
They aggregate data across all of your channels—social media, paid advertising, your websites, and email platforms—and combine it into one view. This enables you to identify trends, monitor KPIs, and create easy-to-understand reports for clients or in-house teams.
These tools are not just glorified databases that hold a set of numbers. They typically include data visualizations such as charts, graphs, and tables. This way, you can quickly identify what’s working without having to sift through complicated raw data.
Most reporting tools provide automatic, real-time updates, so you’ll never miss an opportunity to work with the most up-to-date numbers. Some, like KPI.me, even allow you to create custom reports and automate processes, which can save significant time and reduce errors.
Beyond Basic Spreadsheets
While traditional spreadsheets such as Excel may serve smaller data sets, they fall short in many areas. As marketing data continues to expand, spreadsheets become cumbersome and difficult to navigate.
Advanced tools such as Google Analytics or Google Data Studio manage big data sets with ease. They integrate with additional platforms, refresh automatically in real time, and facilitate sharing with a few clicks.
Specialized reporting tools allow teams to easily apply filters, sort, and group data in seconds.
The Core Goal: Clarity

When produced thoughtfully, clear reports lead teams to make more informed decisions and identify more achievable goals. Visuals—whether line graphs, pie charts, or bar charts—allow everyone to quickly get a grasp on what’s going on.
Purpose of the report: Well-built reports center around the most important information.
Turning Data Into Stories
There’s more to reporting than dollars and cents. Effective reports take the data and weave it into a narrative that illustrates successes, failures, and the overall trend.
Sharing a spike in leads following a campaign or a consistent decrease in ad costs over time helps tell a story with data. Straightforward stories take all the guesswork out of next steps for anyone involved, from marketers to clients.
Why Reporting Tools Matter Now
Digital marketing is an area that moves at lightning speed. Marketers in the U.S. sift through piles of unstructured data every single day. With business moving at an unprecedented pace, this can leave you drowning in data.
Reporting tools provide a necessary counterbalance. When data is spread across hundreds of sources— Google Ads, Facebook, email campaigns, etc.—the manual sorting process is a huge drain on teams’ time. These tools take all of that and more and pull it together, so you’re not just getting little pieces, you’re seeing the whole picture.
Making Sense of Digital Chaos
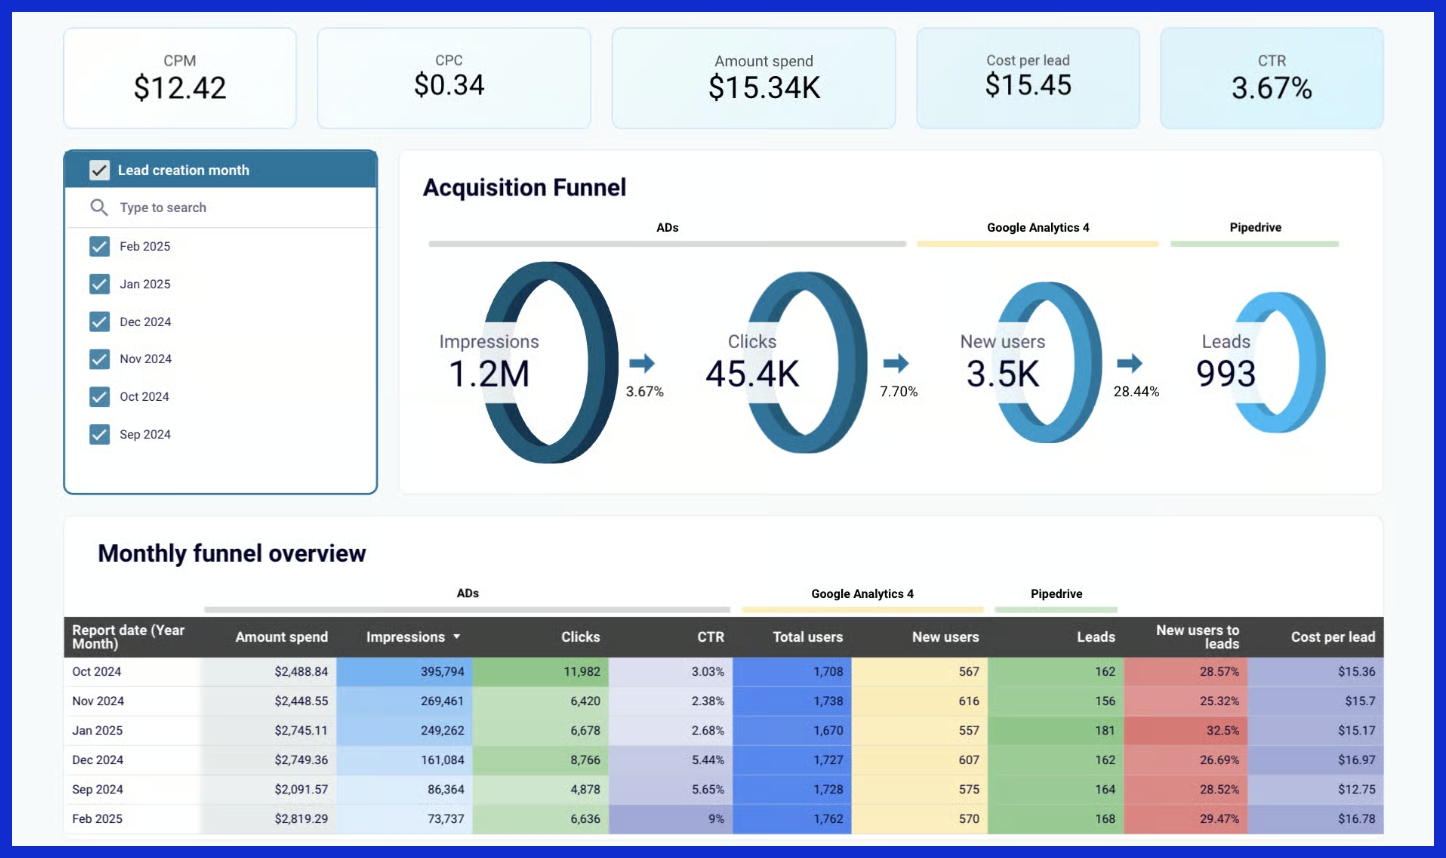
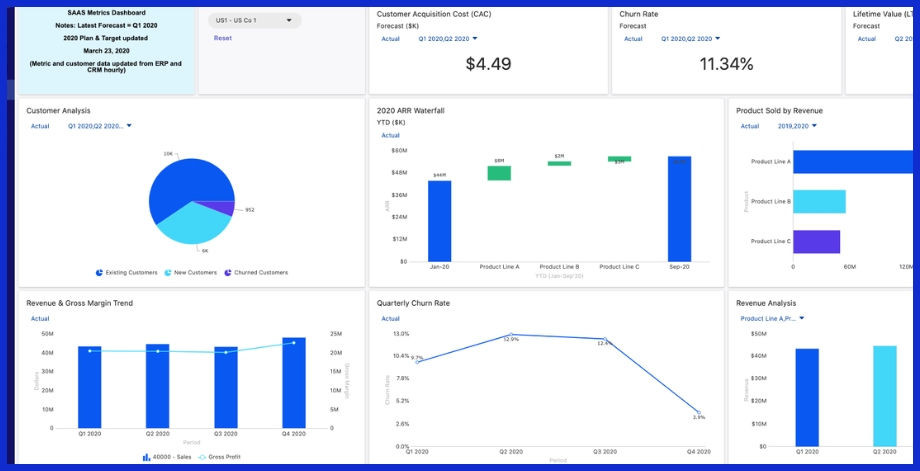
Making sense of digital chaos is essential. Reporting tools help sort through the clutter. They transform chaotic, disparate data points into organized, digestible dashboards.
Say your campaign is pulling in more traffic from Facebook than Google, a decent reporting tool should bring that to light right away. Grouping data by traffic sources, campaign naming conventions, or conversion events allows teams to easily identify what’s performing.
Connecting your CRM, email, and ad platforms allows you to get deeper insights. Rather than clicking back and forth between multiple tabs, you can see everything on one screen.
Justify Your Marketing Spend
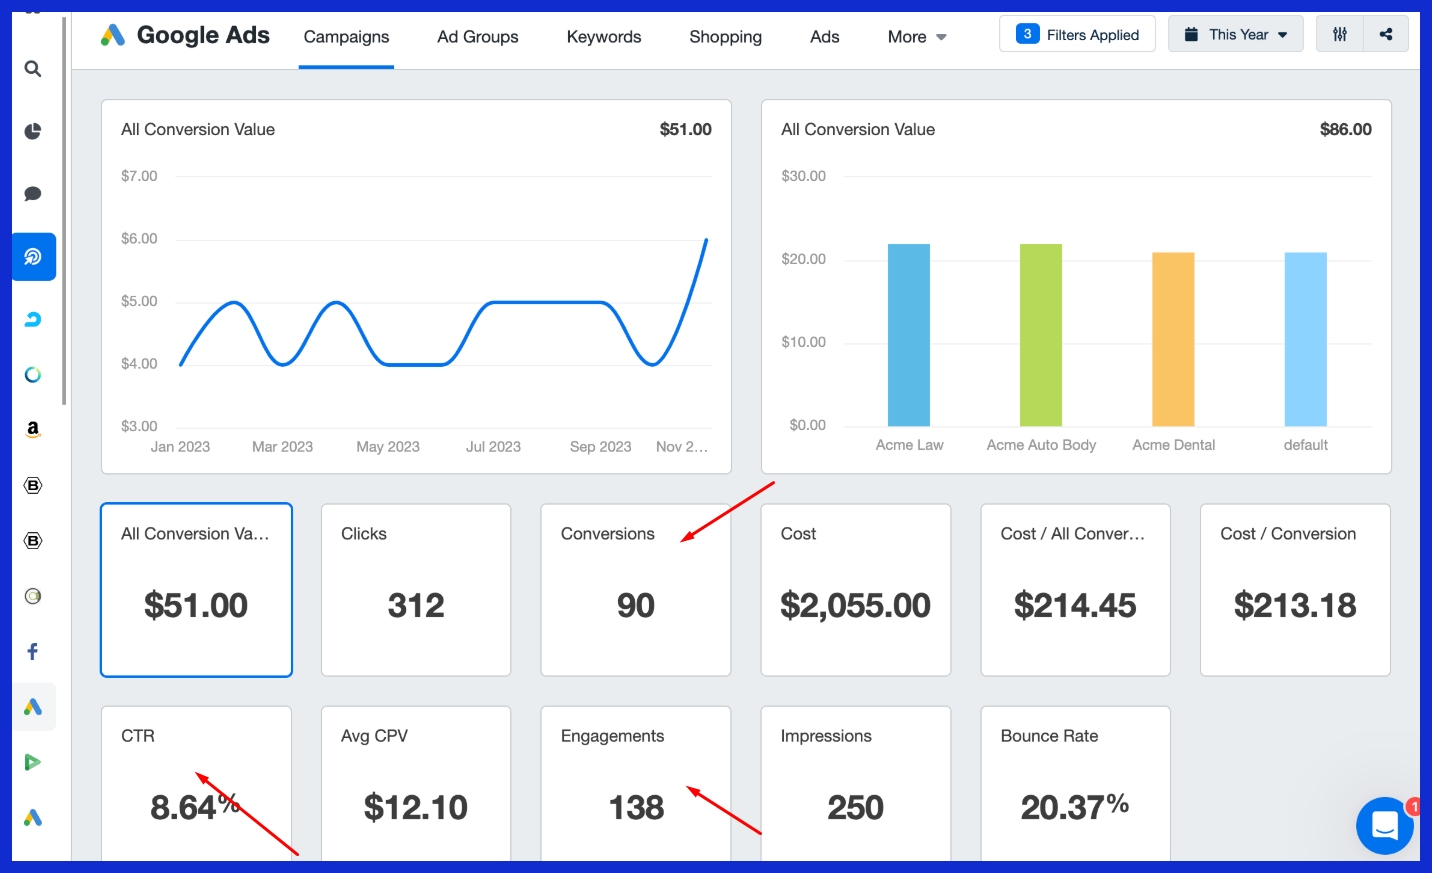
Budgets are very constrained. Agencies and brands are under more pressure than ever to prove results. Reporting tools help you keep an eye on cost-per-click, conversion rates, and ROI.
By providing detailed reports, their teams would be able to demonstrate which ads are generating leads and which are not. When leadership wants to know why a channel deserves money, these figures defend the channel.
These data-backed reports go a long way in justifying spending and directing funds toward more effective modes.
Prove Your Campaign ROI
ROI is so important right now, but few people understand how to calculate it. Reporting tools help you line-itemize how much you spent, what you received, and where the wins were generated.
With clearly defined results, teams can prove to clients or bosses the value of each dollar spent.
Stay Agile with Real-Time Insights
Markets shift fast. With real-time data at their fingertips, marketers can make quick, informed decisions, optimizing their campaigns in real-time.
Dashboards provide a view of current activity, enabling teams to identify patterns, troubleshoot problems, and respond proactively before opportunities are lost. This kind of agility saves time, reduces manual effort, and increases productivity.
Key Metrics: What to Track
Tracking the right metrics is critical for any agency or team trying to demonstrate meaningful progress. In U.S. Digital marketing reporting tools, we are inundated with hundreds of different numbers. It’s extremely important to tune in on the right metrics—the ones that will help you achieve your overall business objectives.
Metrics should be meaningful and action-based. They should give teams an understanding of what is working well and what could use improvement. Balance the hard numbers, such as increased website traffic, conversion rates, etc. Don’t forget to look at softer metrics too, like qualitative user comments or survey data, to get the full picture.
Focus on Actionable KPIs
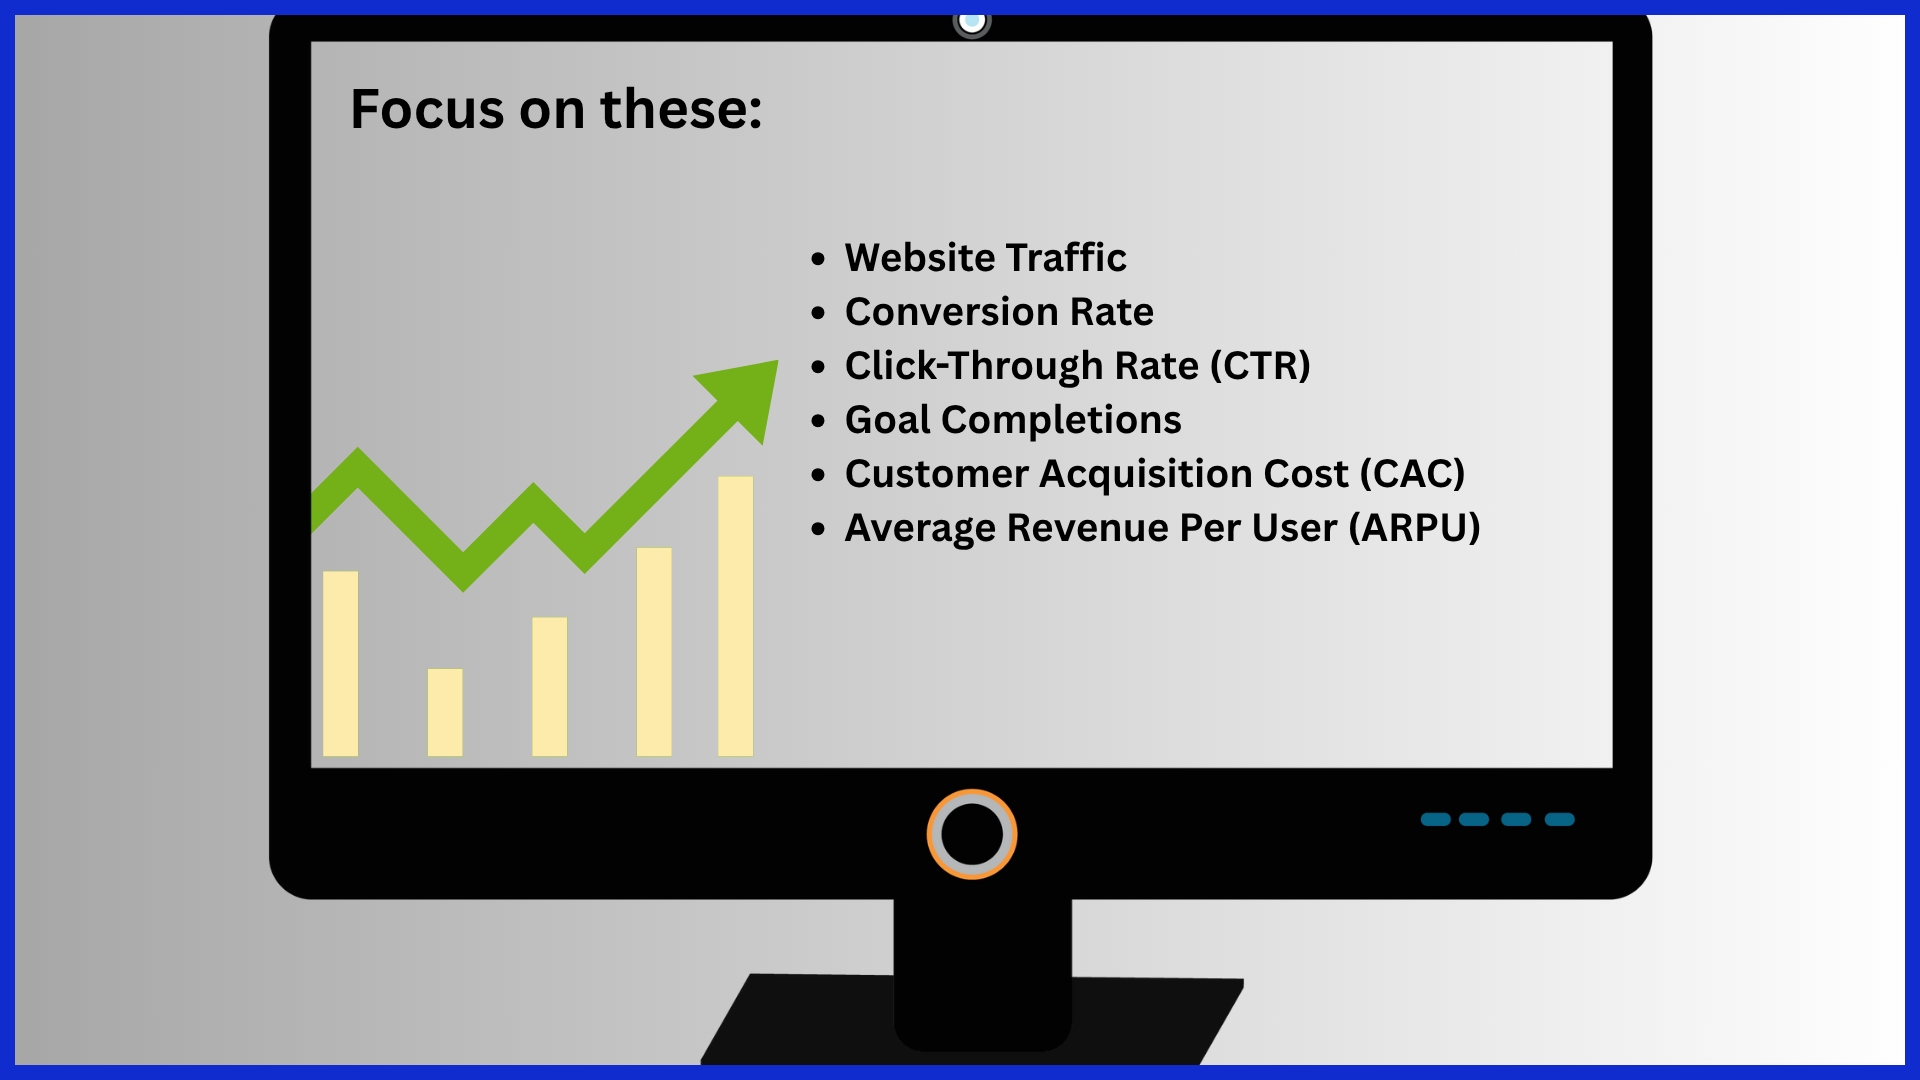
Actionable KPIs are those numbers that lead to tangible changes. Website traffic is the first indicator of how many people you’re reaching on your website. An increase in conversion rate shows you whether or not those visits are resulting in new sign-ups or new sales!
Click-through rate (CTR) and goal completions, such as webinar sign-ups—identify what draws users in. For example, if a channel’s CAC is $100 and ARPU is $150, you understand it’s worth the effort. These KPIs should be reviewed regularly, so reports remain relevant and focus on what is most important.
Strategic vs. Tactical Numbers
Strategic metrics, such as ROI or share of wallet, measure long-term growth and overall objectives. Tactical numbers, such as average session length or exit rate, are useful for immediate, tactical adjustments.
Both types work together: use tactics to hit short-term wins and strategy for lasting gains.
Channel-Specific Performance Indicators
Collecting referring domains, backlinks, and organic clicks for SEO, or CTR for paid ads, will allow you to identify your winners. Utilizing marketing analytics software to compare these numbers across channels enables teams to focus their time and money on the channels that yield the greatest marketing results.
Prioritize Your Core Metrics
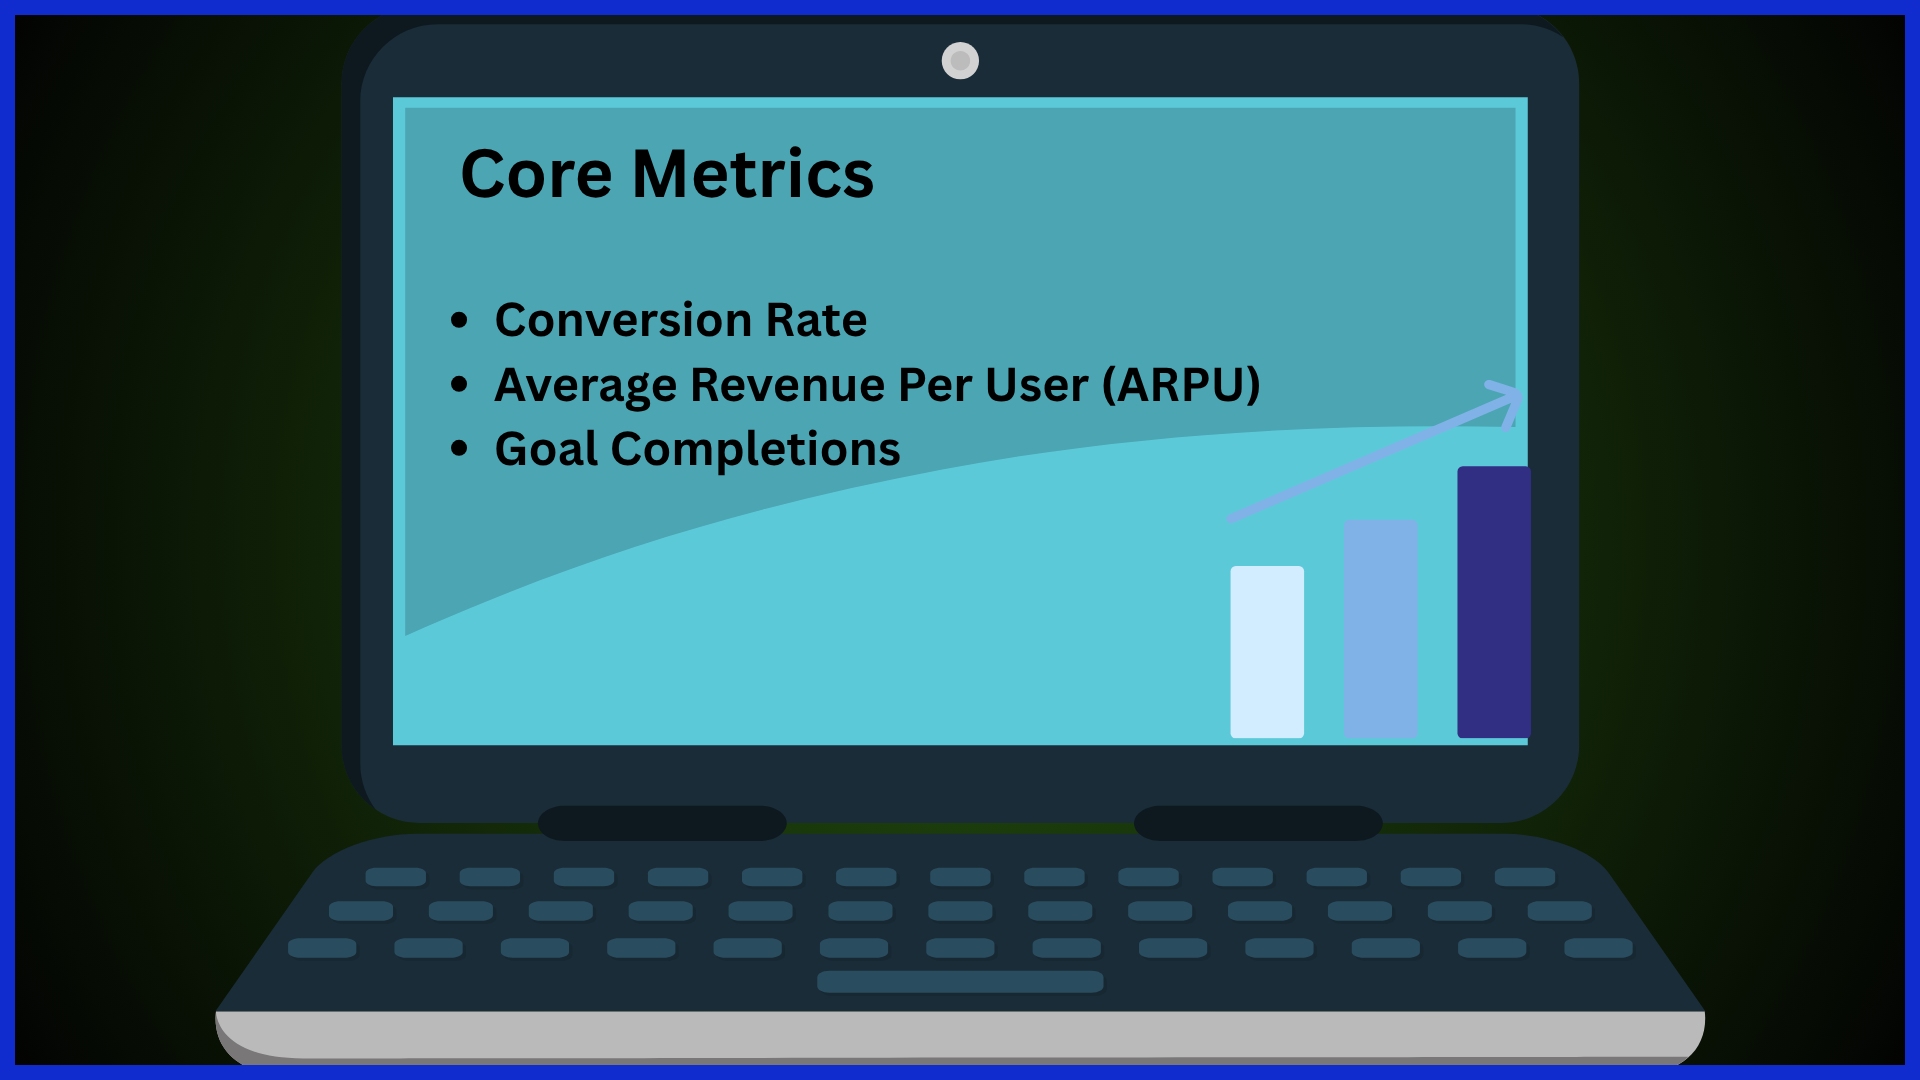
By zeroing in on a few core marketing metrics, such as conversion rate, ARPU, and goal completions, you can create insightful reports without overwhelming your marketing reporting software. Revisit these marketing KPIs to ensure alignment with your business objectives and eliminate those that no longer serve a purpose.
Exploring Digital Reporting Tools
These digital marketing reporting tools allow teams to eliminate the data clutter and truly focus on what’s important. These tools break down into three primary buckets, each designed to address a unique piece of the digital puzzle.
The best tool for the job will depend on what kind of data you’re looking to acquire. Most importantly, it depends on your team’s workflow and the overall purpose you’re trying to achieve.
1. Web Analytics Powerhouses
Web analytics tools, such as Google Analytics or Matomo (formerly Piwik), provide powerful information about site traffic and user journeys. They break down bounce rates, traffic sources, and user flows, letting marketers spot trends and see what keeps visitors engaged.
Combined, these features can inform SEO and content strategies by identifying which content is performing well and where users are exiting the funnel.
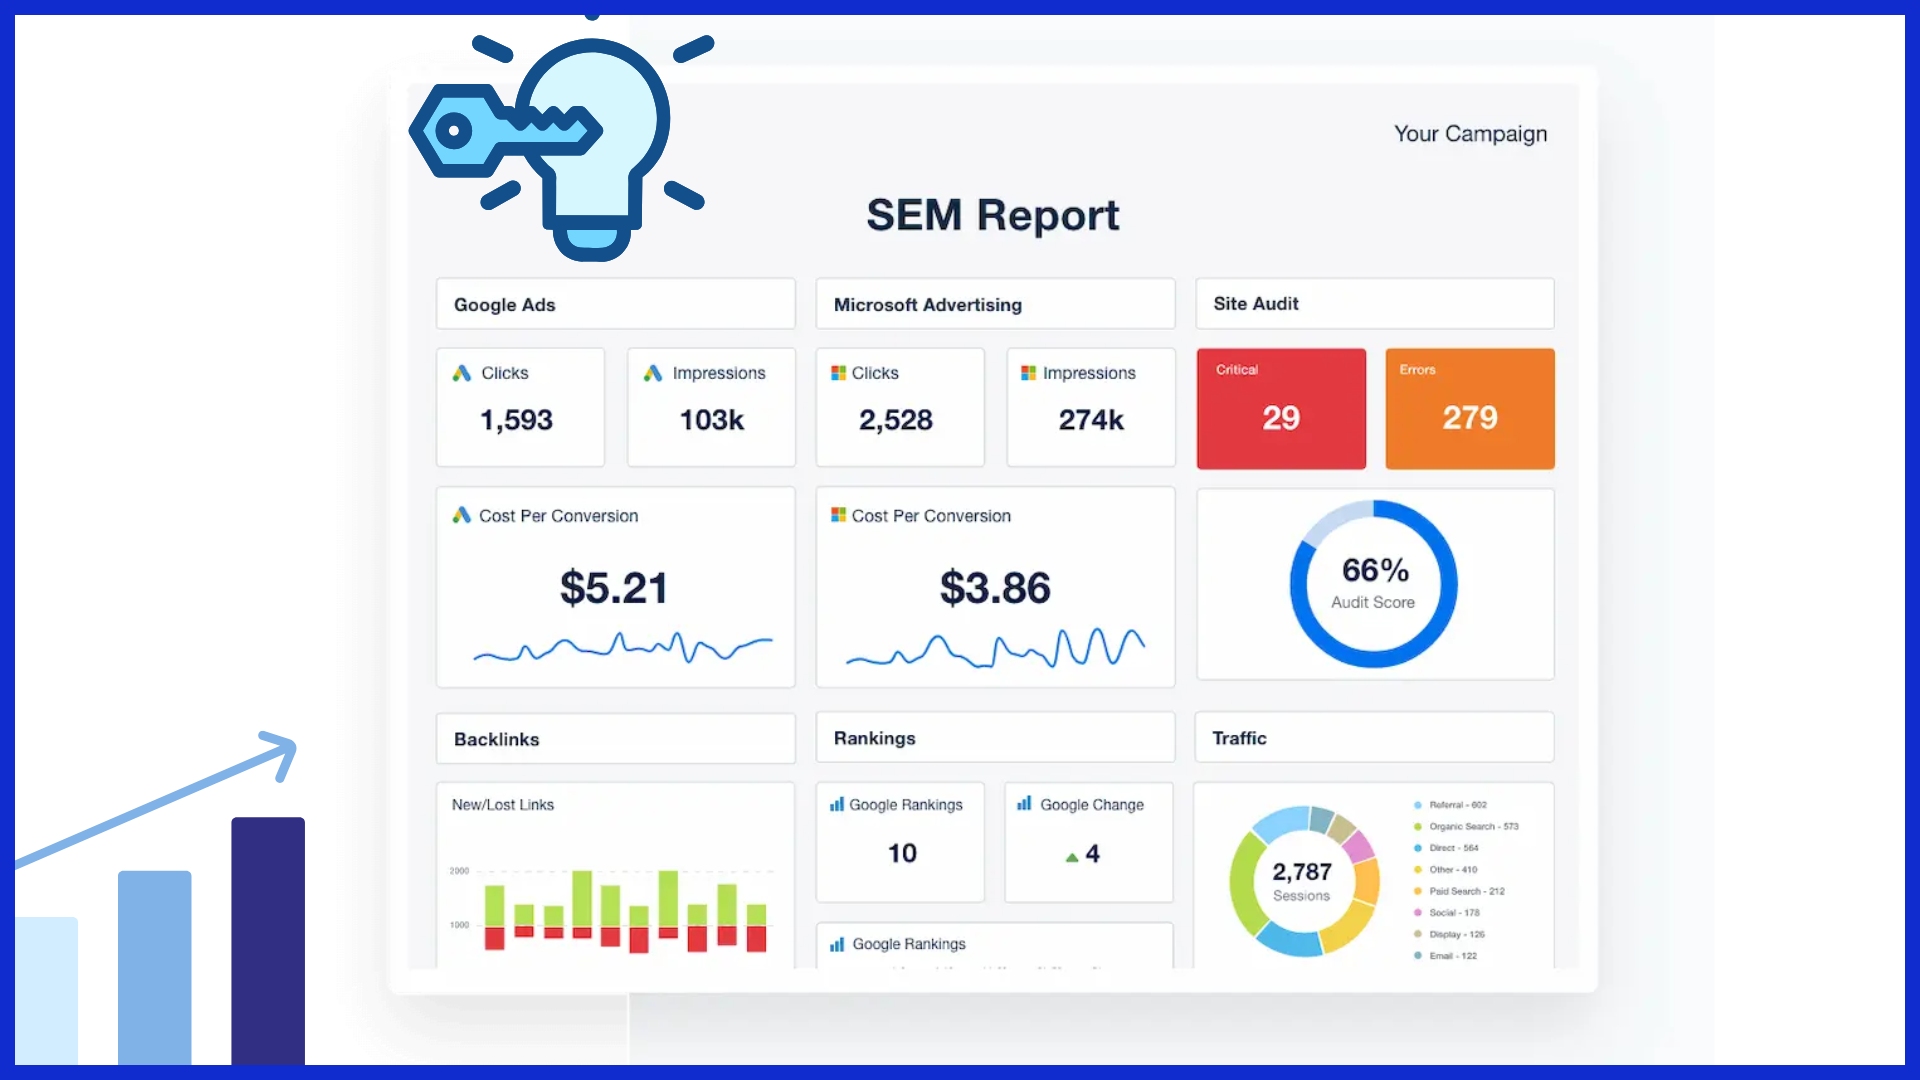
2. SEO & SEM Insight Engines
Tools like SEMrush and Ahrefs monitor keyword rankings, backlink profiles, and paid search performance. These tools illuminate search trends, surface technical SEO concerns, and recommend strategies to increase visibility.
Linking SEO performance to bigger initiatives allows teams to identify missing pieces and allocate resources more effectively.
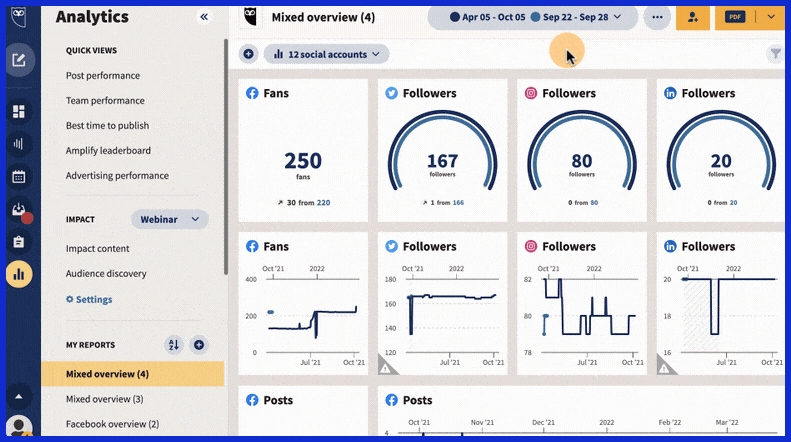
3. Social Media Monitoring Tools
Sprout Social and Hootsuite are popular options for tracking clicks, shares, retweets, brand mentions, and other interactions across all channels. They allow teams to measure sentiment, get ahead of the curve with breaking news and hot topics, and pivot content at a moment’s notice.
This feedback loop is essential to carefully crafting an organization’s public image and ensuring that messaging remains on point.
4. Email Marketing Performance Trackers
Both Mailchimp and Campaign Monitor do a good job of tracking open rates, clicks, and conversions. Intuitive, clear dashboards allow users to easily identify successful emails versus the ones that flop.
Frequent reporting allows editorial and design teams to continually optimize subject lines, copy, and design to improve performance over time.
5. All-in-One Dashboard Platforms
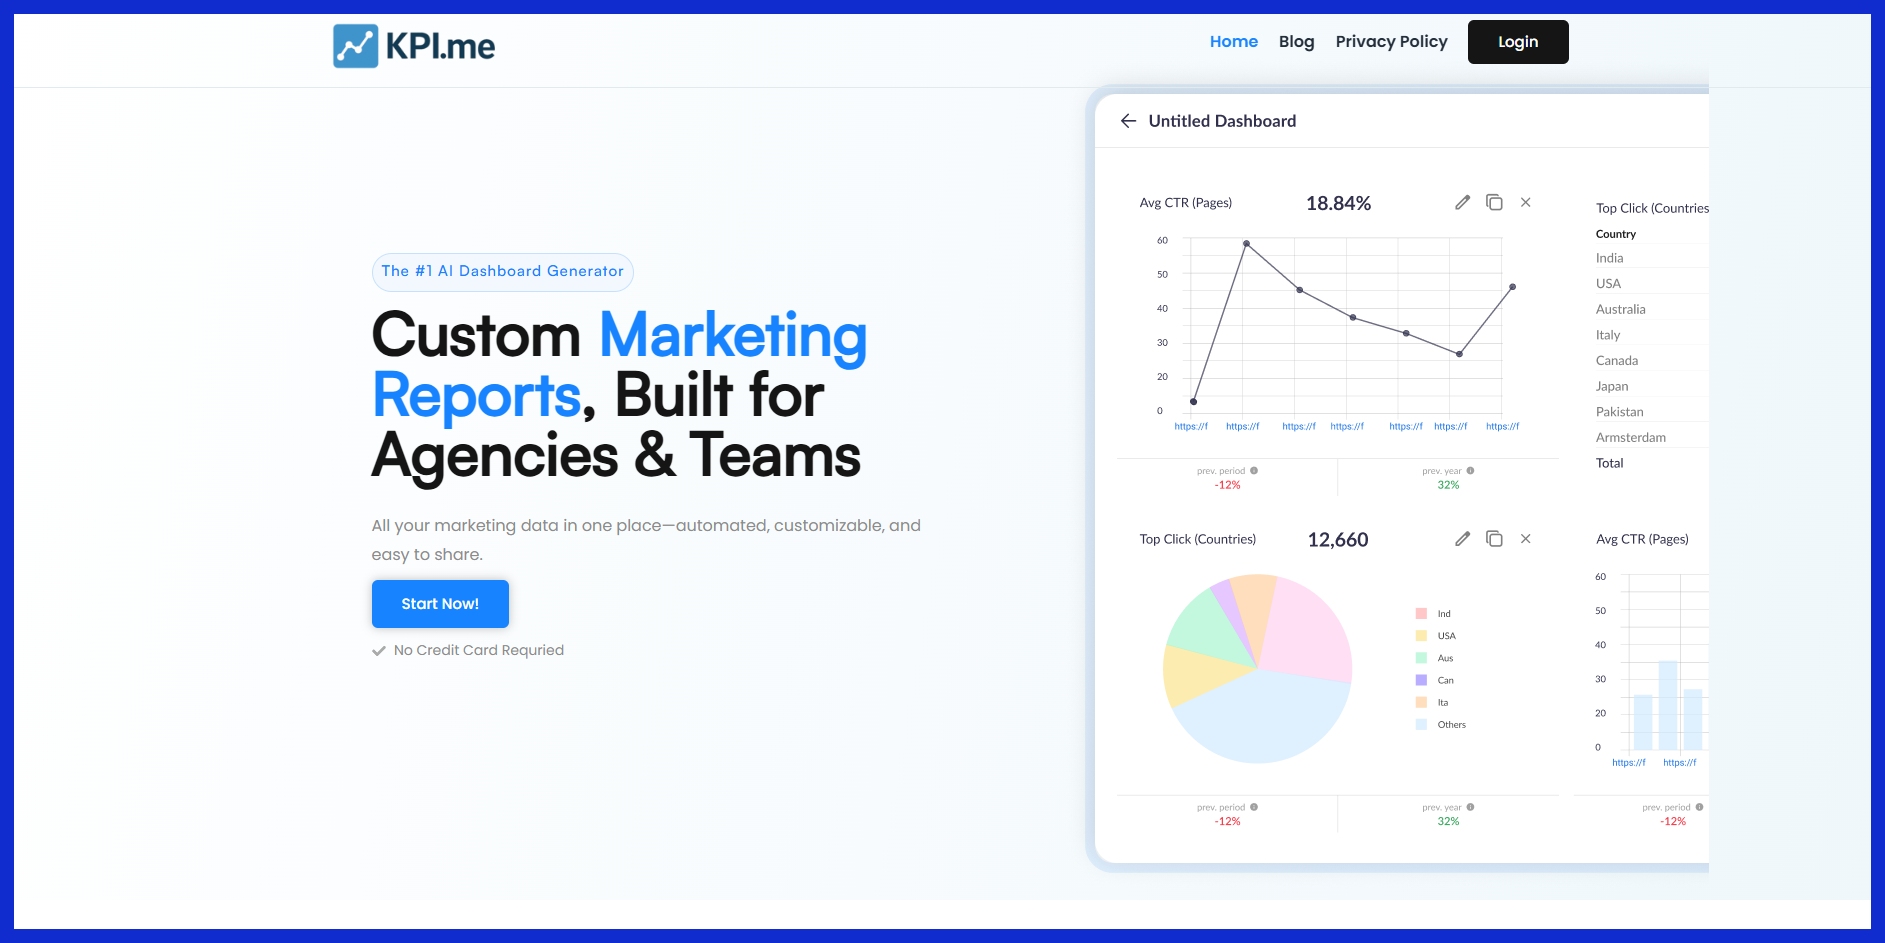
Dashboard-centric platforms such as KPI.me aggregate data from multiple sources into a single location. They provide default templates, drag-and-drop widgets, and quick report distribution—ideal for at-a-glance analysis.
With custom dashboards, every user can view the information that is most important to them in real-time.
6. Data Integration & BI Systems
Power BI and Tableau easily integrate data from multiple apps and platforms, making it simple to identify larger trends. These systems can help save time by automating repetitive monthly/annual reports.
Additionally, they allow you to have all your data integrated for more in-depth analyses.
Choose Your Ideal Reporting Tool
Selecting the ideal marketing reporting software requires a little upfront consideration. Today’s marketers are inundated by data, from SEO metrics to paid search and social impressions. Each reporting client has their priorities and needs. Choosing a tool that addresses these needs, such as digital marketing reports, is a win-win for all, saving staff time, keeping things transparent, and making more informed decisions.
Define Your Business Needs First
Define Your Business Needs First. Perhaps you generate reports for multiple clients, or your in-house team manages paid and organic channels. Those goals might be demonstrating campaign ROI, monitoring website conversions, or communicating with constituents in real-time.
An ideal tool would allow you the flexibility to choose what metrics are most important to highlight in each report. If you need both static reports and live dashboards, look for tools that let you build both from the same templates. This helps ensure that you and your team aren’t spending unnecessary time recreating things.
Evaluate User Interface and Ease
The last thing you want is a complicated tool that no one on your team knows how to use. Evaluate User Interface and Ease. Find a solution that has easy-to-use navigation.
It needs to allow you to quickly add charts, graphs, or other custom widgets with minimal training. Tools that allow you to save custom templates for your team make it easier to ensure everyone is working off the same playbook.
Consider Scalability and Pricing
Consider Scalability and Pricing. Your business will be expanding, and your tool should expand with you. Look for flexible pricing plans—does it have a free trial or a forever-free tier?
That allows you to do a trial run before you make any long-term commitments. Be wary of other additional costs, such as fees for adding users or data integrations.
Top Digital Marketing Tools
Here are some tools you can check out:
|
Tool |
Key Features |
Advantages |
Disadvantages |
|---|---|---|---|
|
Google Data Studio |
– Connects with Google platforms (Analytics, Ads, Sheets) – Custom dashboards and visualizations |
– Free to use – Strong integration with Google tools |
– Limited native integrations with non-Google platforms – Learning curve for new users |
|
KPI.me |
– AI-powered dashboard creation – Easy data source integration – Smart KPI suggestions |
– Simple setup with intuitive UX – Great for real-time insights – Ideal for small to mid-sized teams |
– Still expanding third-party integrations – Limited customization compared to enterprise tools |
|
Tableau |
– Enterprise-level data visualization – Robust analytics capabilities |
– Handles large datasets – Highly customizable dashboards |
– Expensive for small businesses – Requires technical expertise |
|
Databox |
– Pre-built templates – Mobile reporting – Integrates with 70+ platforms |
– Easy to set up – Great for agencies and real-time tracking |
– Can get pricey at scale – Less flexibility in custom reports |
|
DashThis |
– Drag-and-drop report builder – Pre-set marketing KPIs |
– User-friendly interface – Good for marketing agencies |
– Limited advanced features – Customization options can be restrictive |
|
AgencyAnalytics |
– White-label reporting – SEO, PPC, social dashboards |
– Built for agencies – Client-friendly reports |
– Not as strong for deep data analysis – Pricing based on client volume |
|
Looker (part of Google Cloud) |
– Advanced business intelligence – Data modeling capabilities |
– Powerful for complex queries – Great for enterprise analytics |
– Expensive and complex for smaller teams – Steep learning curve |
Craft Actionable Marketing Reports
For agencies and in-house digital marketing teams, a great report goes beyond the data dump. Reports that lead to tangible change begin with a plan. Whether it’s tracking YouTube campaign metrics, monthly PPC results, or page load times, you’re on top of it all!
Establishing what the report needs to address ensures you focus on insights vs. just datapunk numbers. Whether designing a digital or print report, clarity and focus should always be your guiding principles. Place the key conclusions and recommendations first.
Know Your Report Audience
Make each report specific to the audience reading it. That might be executive-level managers concerned about pacing on the overall budget, or it could be account managers who need to see channel comparisons side by side.
This allows you to prioritize the metrics that are most important to your audiences, whether that’s tracking email open rates or device performance. Continuing to solicit input from report consumers is a must.
Ping with short surveys or team touch bases to ensure that subsequent reports are as actionable as possible!
Visualize Data for Quick Wins
Charts and graphs make it easy to visualize trends, spotlight benchmarks, and draw attention to wins or gaps quickly. A simple monthly chart showing reinvestment from two campaigns side by side is much more useful than pages of a spreadsheet.
Visual storytelling, whether through infographics, dashboards, or just a few clear graphs, makes reports more accessible and actionable.
Focus on Insights, Not Just Stats
Effective reports are those that answer actual questions—how to allocate next month’s budget, what performed best last quarter. Focus on insights, not just stats.
Supplement key numbers with pithy summaries or actionable recommendations. Sometimes, a short story is the best way to connect the dots and point out all the big-picture lessons learned.
Future of Marketing Reporting
Marketing reporting continues to evolve as new tools and requirements emerge, including advanced marketing reporting software. Agencies and internal teams need answers yesterday, and clients require actionable reports and innovative concepts. Being future-ready necessitates proactively understanding what’s going to inform the digital marketing reports of the future, beyond just tech advancements.
AI and Predictive Analytics Rise
AI and predictive analytics are taking marketing reporting into safer, speedier ground. These tools can sift through massive amounts of data and identify trends that other teams would overlook. Predictive analytics pulls historical data to forecast outcomes, allowing teams to mitigate risk and plan, rather than solely react.
The market for these tools is growing at an explosive rate of more than 23% per year. That’s because the majority of agencies have started utilizing AI to predict what’s coming down the pipeline so they can stay one step ahead. With predictive analytics, teams can better detect changes between seasons and see what creatives perform best.
They can develop the right KPIs to tie together in smart ways.
Navigating a Cookieless World
As third-party cookies are on their way out, so too must reporting. In a world without cookies, marketers must rely on first-party data, such as information from website interactions or email registrations. Getting with the times, adapting looks like creating reports that comply with privacy laws while providing valuable insights.
Approaches such as monitoring user pathways across the web or leveraging aggregated, de-identified information are on the rise. It’s about learning how to measure what matters without sacrificing trust.
Advanced Data Visualization Trends
Customized dashboards have become the expectation. Good data visuals, like live charts or interactive graphs, help teams share results in meetings or show annual trends quickly. Instruments that allow you to create custom visuals are coming out on top, though, allowing reports to be more easily tailored to any audience.
Beyond creating presentations, clear visuals enable teams to identify trends and shifts in the market as they happen.
Conclusion
The best digital marketing reporting tools take the strain out of the process and save busy teams precious time. Dashboards that cut to the chase and get you to the important stuff quickly—zero nonsense, zero clicks gone to waste. You end up with numbers that tell a story, not just graphs that look nice.
Some of these tools go as far as automatically pulling in data from Google, Facebook, or Shopify in a matter of seconds. With intelligent reporting, you can identify successes and opportunities in record time, allowing you to pivot and re-focus efforts to achieve your objectives.
With alternatives such as KPI.me, you avoid the hefty price tags while still enjoying all the professional quality features. Experiment with what meets your requirements and determine what works best for your team. Stop merely staring at your data and start utilizing it.
Begin taking smarter, more strategic moves and get your team one step closer to being future-ready. Take your reporting to the next level with the perfect tool.
Frequently Asked Questions
What is a digital marketing reporting tool?
It allows you to easily measure marketing performance metrics across channels such as Google Ads, Facebook, and email, all from one marketing dashboard.
Why should my business in Los Angeles use reporting tools?
Digital marketing reporting tools, such as marketing analytics software, allow Los Angeles area businesses to know what’s working in their competitive local market. They simplify marketing data sources and show where to focus for better results, saving you time and money.
What key metrics should I track in digital marketing?
Monitor your website traffic, conversions, click-through rates (CTR), return on ad spend (ROAS), and engagement rates using marketing analytics software. These important metrics reveal how effectively your marketing campaigns are performing.
How do reporting tools support better decision-making?
They make actionable insights out of unwieldy marketing data sources. Using visual dashboards, such as marketing analytics software, you identify trends and make more informed marketing decisions in an instant.
What features should I look for in a digital marketing reporting tool?
Find a marketing reporting software with real-time data syncing, customizable dashboards, easy integrations with platforms you currently use, and automated report scheduling.
Are digital marketing reporting tools hard to set up?
The majority of marketing reporting software will walk you through the setup with simple steps. Most provide plug-and-play integrations with all of your favorite platforms, allowing you to get started with digital marketing reports in no time.
How will marketing reporting tools evolve in the future?
Look for increased automation and AI-based analysis. Reporting tools will become more advanced at anticipating trends and recommending next steps, shifting your marketing from reactive to proactive and creating a more intelligent, efficient machine.