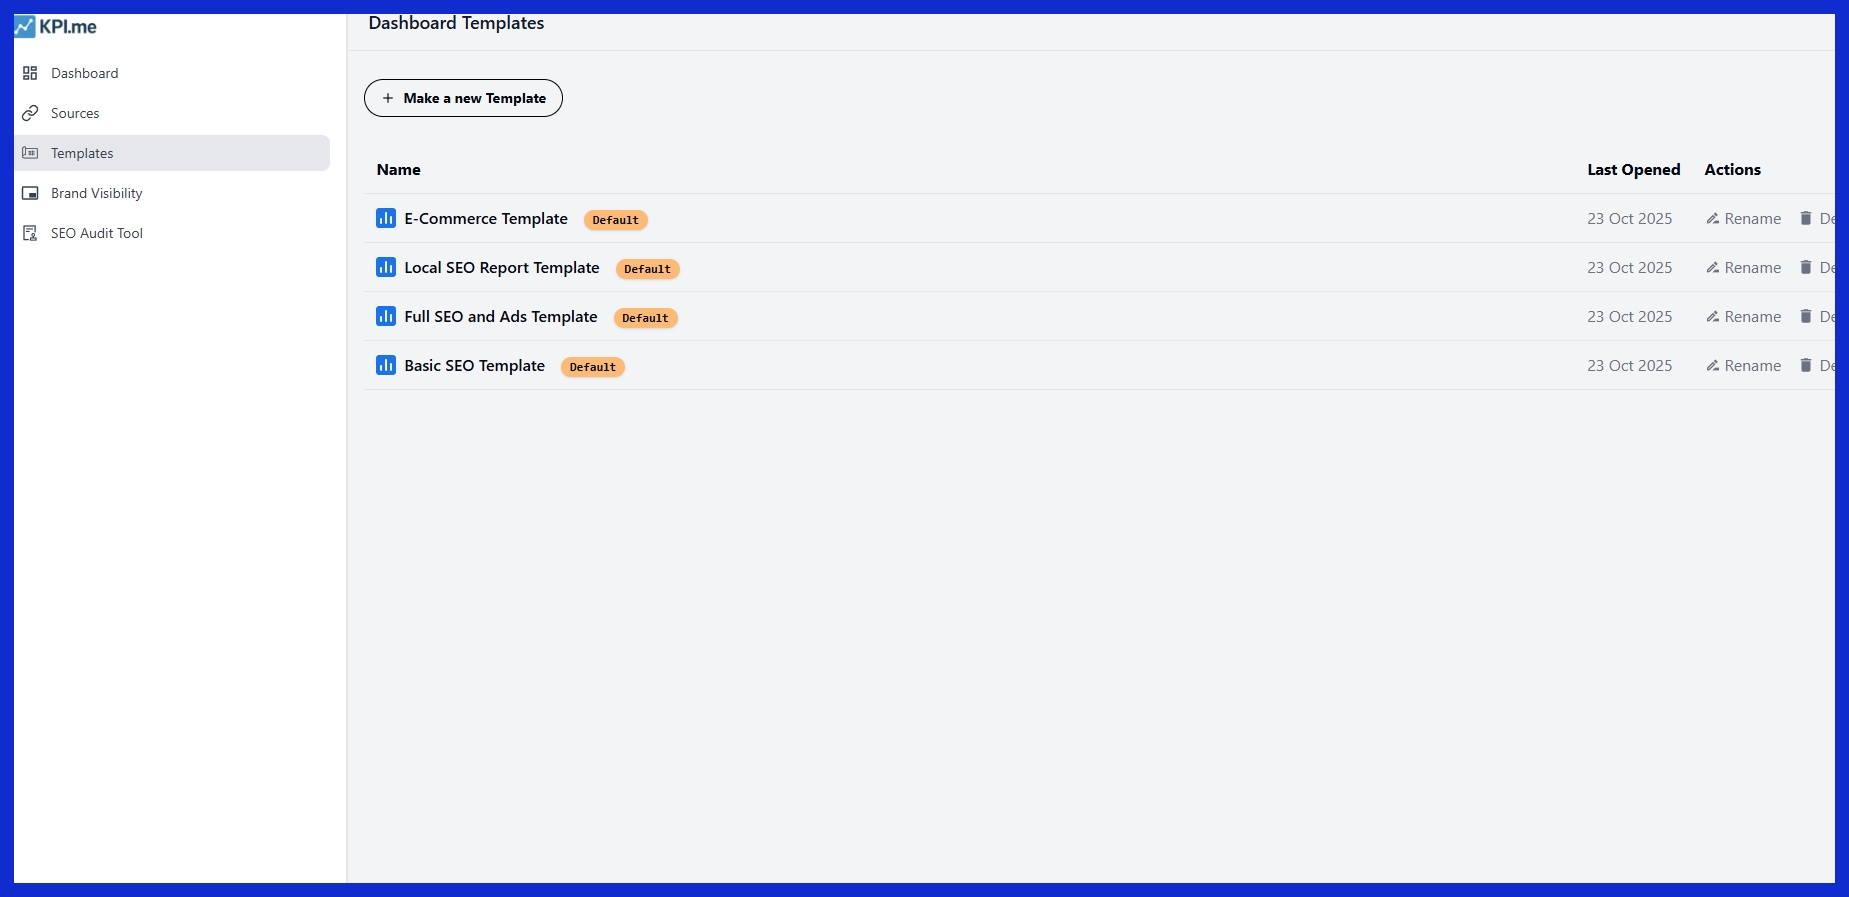
What are the Key Sales Metrics to Track for Your Reports
Key Takeaways
-
The sales metrics you track give you crucial insight into your team’s performance, your customers’ behavior, and where the market is headed. This insight empowers you to make smart decisions and grow.
-
A quantitative and qualitative balance provides a more holistic picture of sales effectiveness and areas for enhancement.
-
Periodically review and update your key sales metrics to ensure they remain aligned with your changing business goals and market conditions.
-
Distinguishing leading from lagging indicators allows you to make proactive strategy adjustments and measure past performance.
-
By creating a measurement infrastructure with explicit objectives, appropriate metrics, and appropriate tools, you’ll enable accountability and iteration.
-
Steering clear of vanity or lagging metrics and keeping context top of mind results in more actionable insights and superior sales results.
Key sales metrics to track measure the performance of your sales teams, such as win rate, sales cycle length, and average deal size.
These metrics help teams identify what works, detect trends, and prepare for the future. When sales teams track the right numbers, they can make intelligent decisions and increase sales.
It breaks down these key metrics and shares tips for using them in day to day work.
Why Sales Metrics Matter
Sales metrics are not just digits. They’re the lenses through which businesses can view the successes and failures of the sales force. By monitoring sales data, firms can identify what works, what doesn’t, and where to invest their time and money.
Metrics range from how many sales calls a rep makes to how many deals close and where the highest quality leads originate. This provides a true snapshot of what’s going on, so teams can make decisions that align with their objectives. As Peter Drucker put it, ‘what gets measured gets managed.’
By knowing what to track, teams can stay focused on the right actions and keep their performance moving forward.
Beyond Numbers
Metrics don’t only reveal how many sales occurred. They assist teams in comprehending how buyers behave and what trends influence the market. For instance, a sales spike follows a new product launch — that information tells you what customers desire.
The true significance is in reading the narrative behind the figures. Teams question why one region sells more or why conversion rates drop at a particular stage. This results in actionable steps for growth, not just a recounting of what transpired.
Sales call or customer feedback anecdotes sprinkled among the figures provide a more complete picture. If conversion rates fall but the feedback is that buyers are confused, then it’s not more calls you need; it’s clearer messaging.
It’s key to communicate these results in clear, simple language so everyone on the team understands the implications of the numbers and the next steps, keeping everyone aligned.
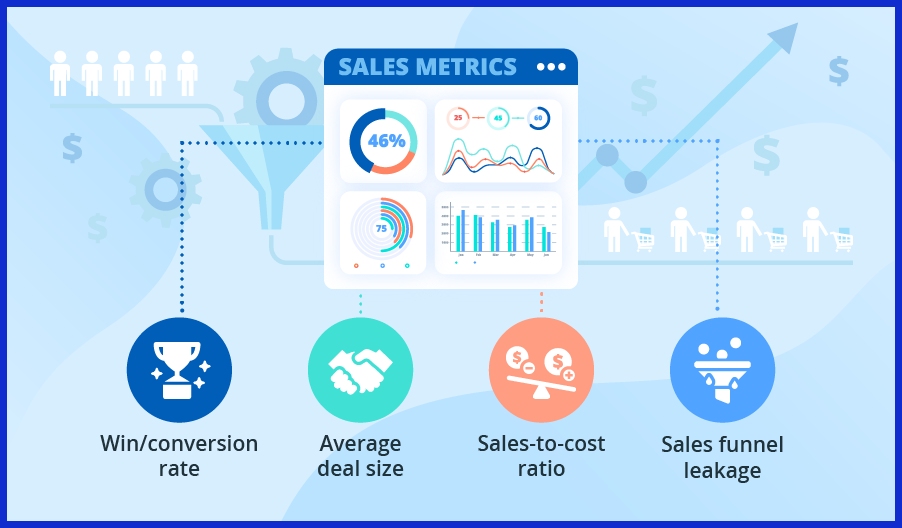
Essential Key Sales Metrics
Sales teams need data to refine their strategy, increase outcomes, and stay ahead of changing market demands. Monitoring the correct blend of sales metrics is crucial for agencies and SaaS teams that aim to achieve performance objectives and maintain agility as business evolves.
These metrics help identify what’s working and where to optimize. Metrics should tie back to your goals — more leads, shorter cycles, or more revenue. Frequent reviews and updates keep the list fresh. Some important sales metrics to track include:
-
Activity metrics (calls, emails, meetings, follow-ups)
-
Pipeline metrics (deals by stage, stage conversion, pipeline velocity)
-
Outcome metrics (total sales, win rate, customer acquisition cost)
-
Efficiency metrics include cost per lead, sales cycle length, and lead-to-deal ratio.
-
Customer metrics (satisfaction, retention, lifetime value, feedback)
1. Activity Metrics
Activity metrics indicate how hard a sales team works. Monitoring total outbound calls can identify reps who need assistance with time management. If one rep makes double the calls of another and gets the same results, you might examine call quality.
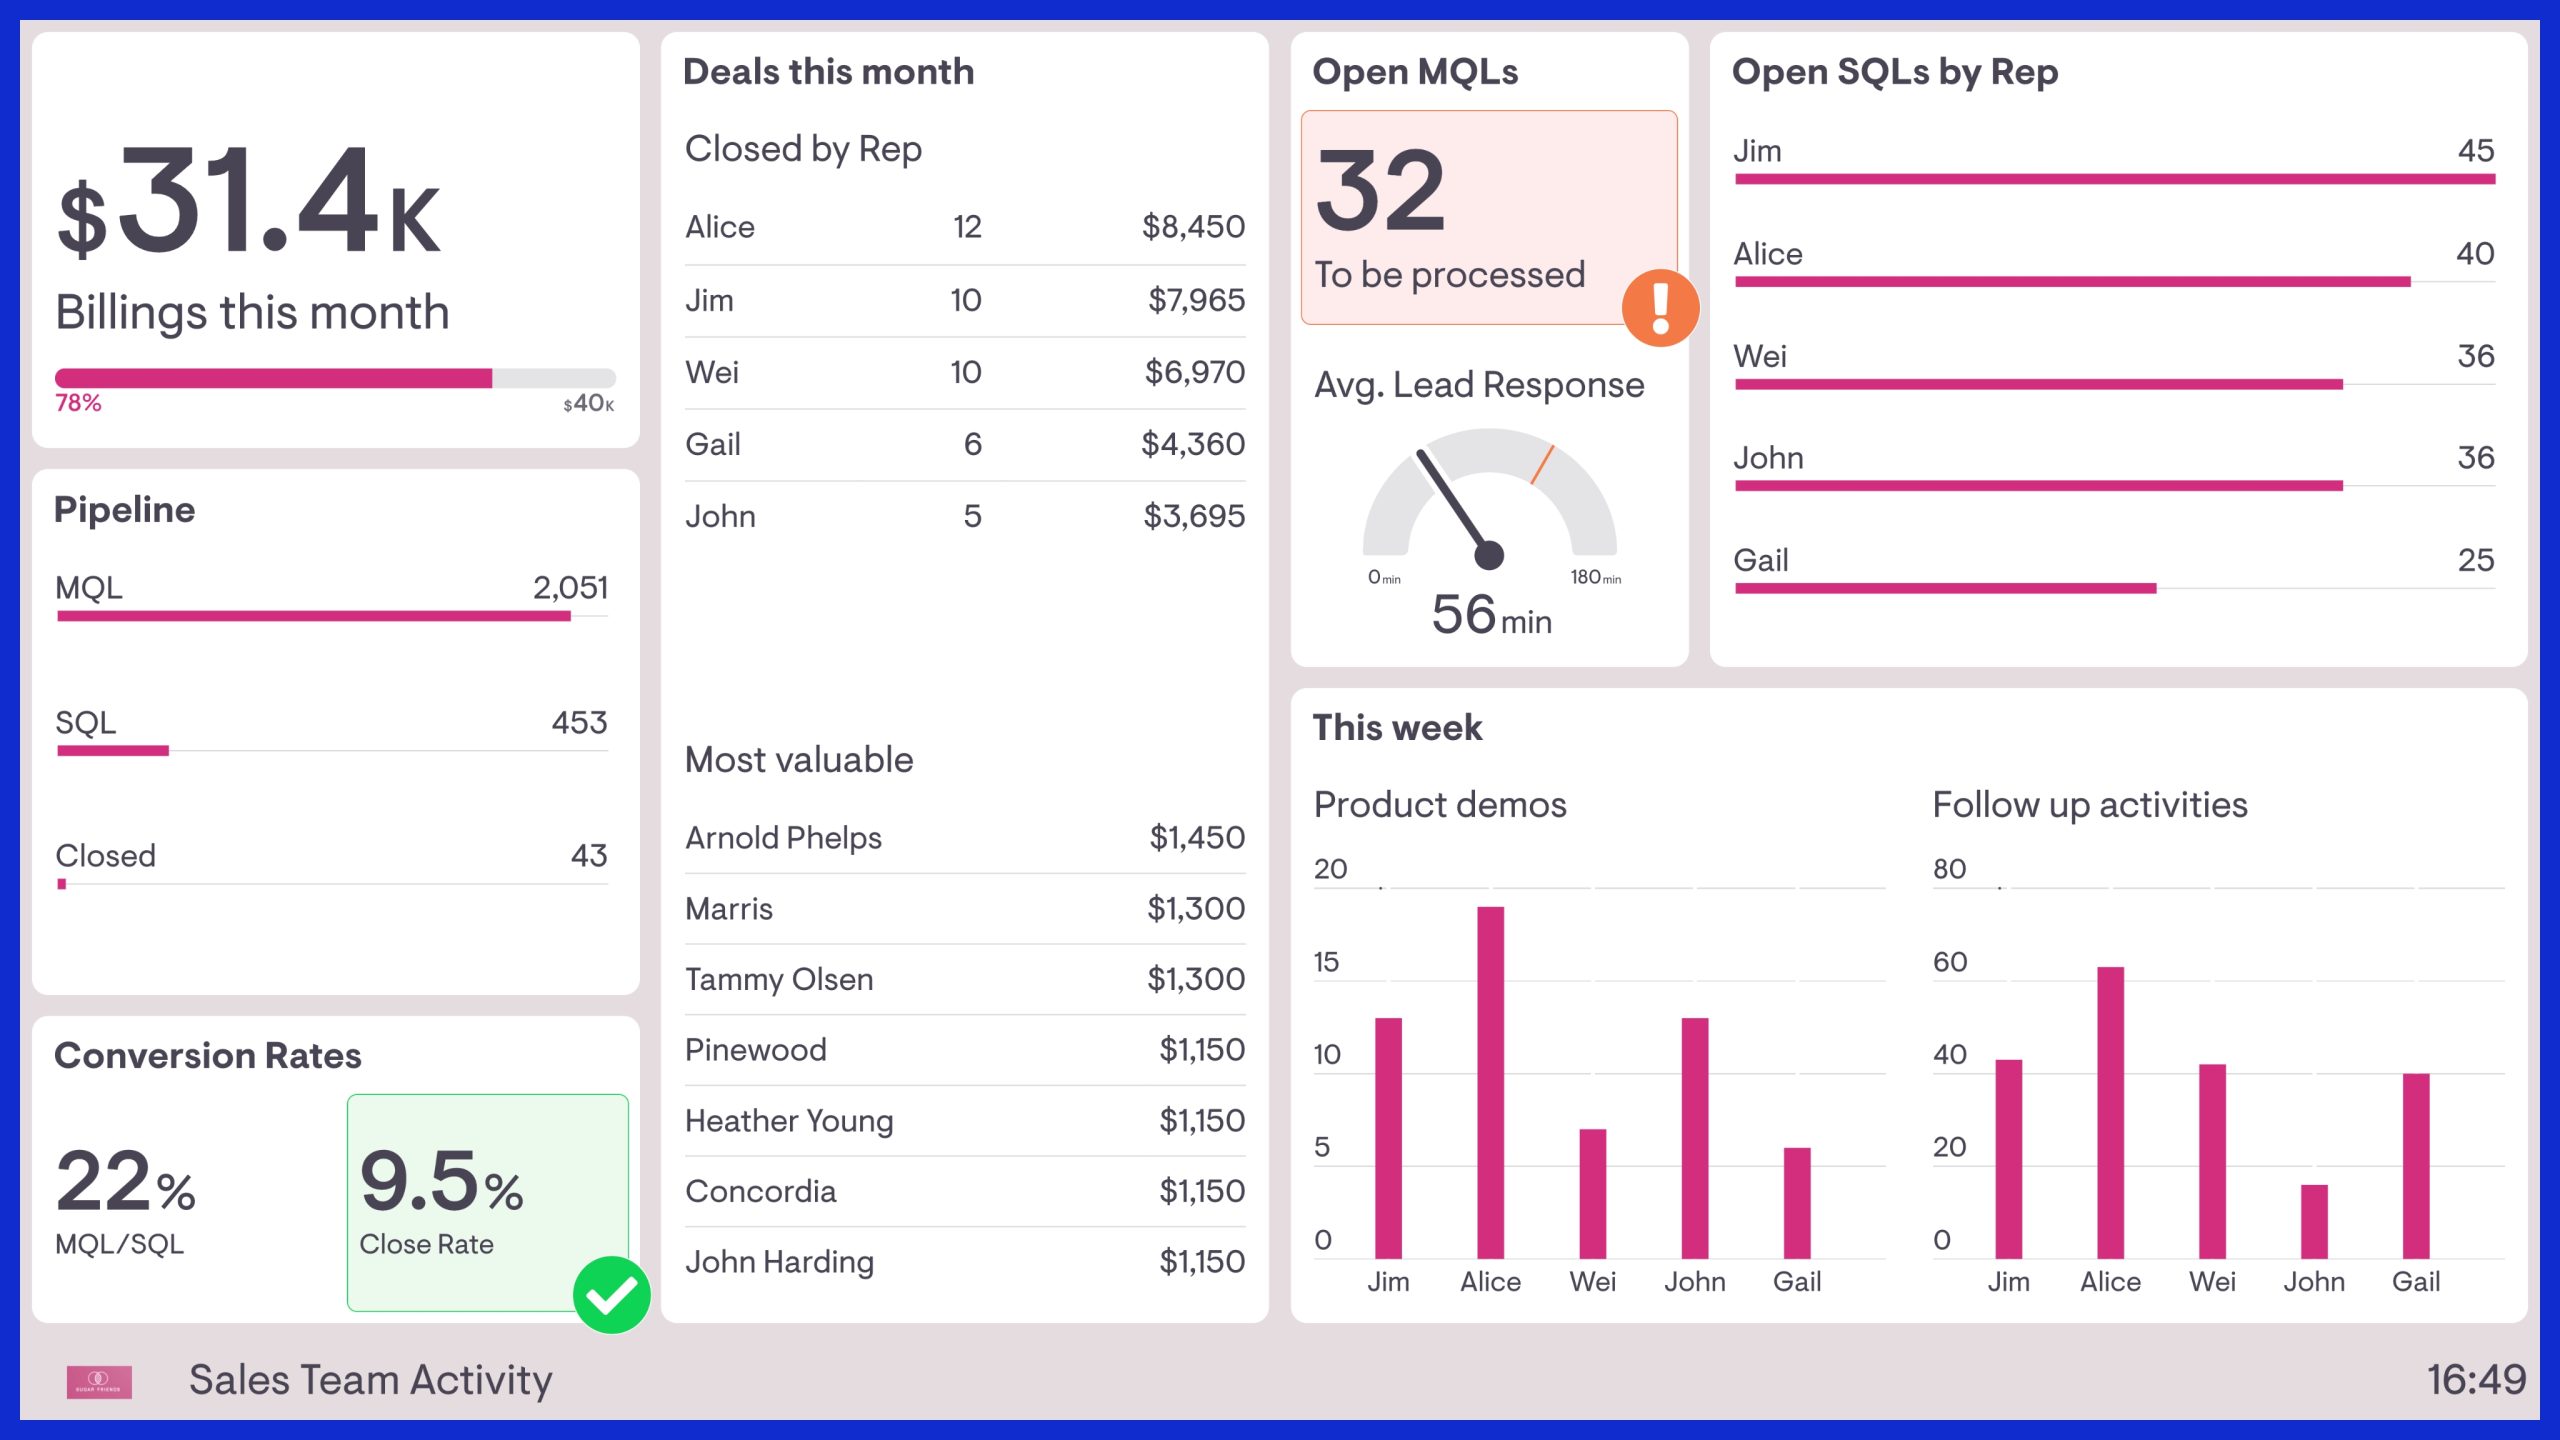
Email open rate tells how engaging your subject lines are or how well your sender reputation holds up. Compute as emails opened divided by emails sent multiplied by 100. Email response rate shows whether your message is landing with prospects, responses divided by emails sent multiplied by 100.
Qualified meetings or demos booked is another key metric, bridging outreach and sales conversations. Follow-up, follow-up, follow-up. Most deals require multiple touches to close. Visual dashboards allow teams to identify sales trends and respond quickly.
2. Pipeline Metrics
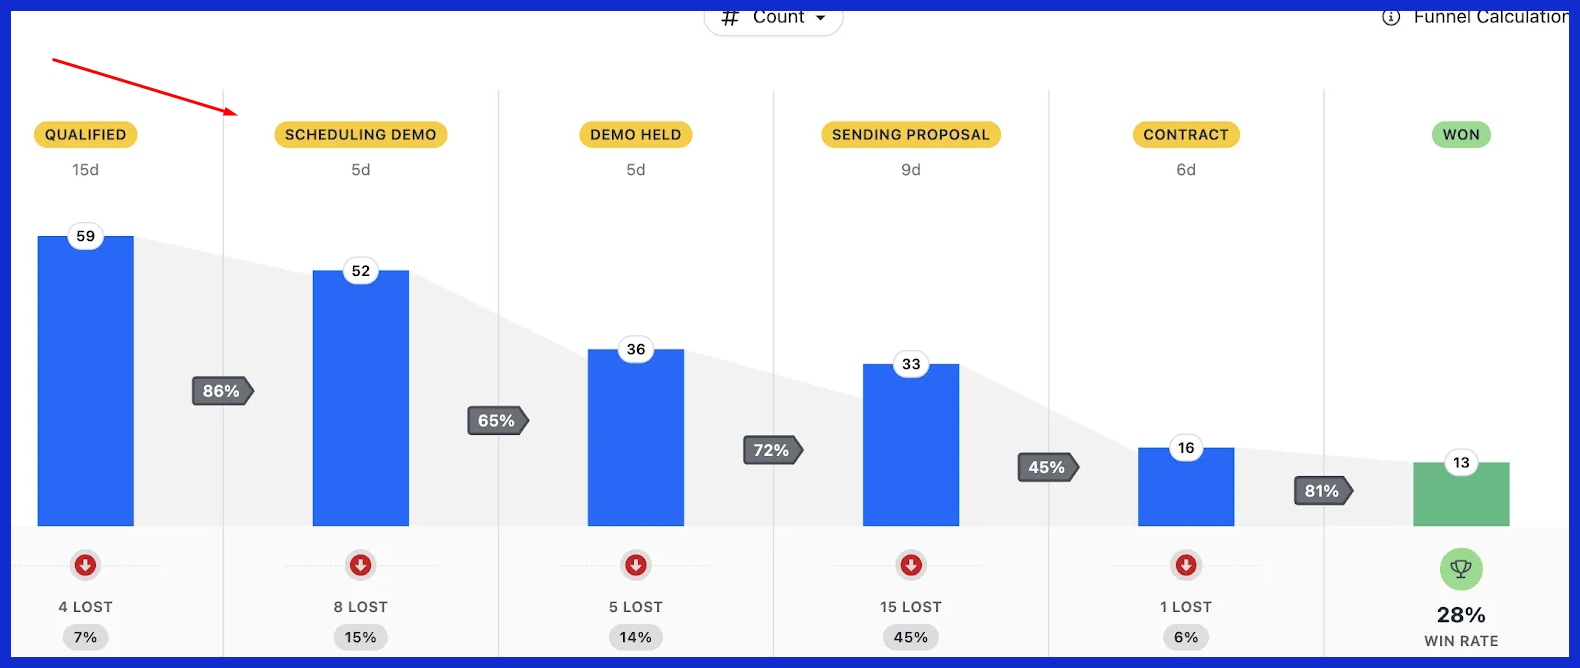
Pipeline metrics let you observe the journey of deals from initial contact to closure. Verify the count of deals at each pipeline stage and observe the duration of each deal. If deals get stuck, it typically indicates a bottleneck or process hole.
Measure conversion rates from stage to stage to identify where prospects fall out. Visual pipeline tools provide a quick read on progress and help teams shift focus when necessary.
3. Outcome Metrics
These are outcome metrics because they demonstrate real business impact. Teams track total sales revenue by period, making it easy to compare and spot trends. Win rate, which is wins divided by total quoted opportunities multiplied by 100, demonstrates if your tactics are effective.
Keep tabs on customer acquisition cost to measure spending efficiency. These figures establish benchmarks and tune strategies, so your sales strategy remains down-to-earth and practical.
4. Efficiency Metrics
Efficiency metrics focus on cost and process velocity. Cost per lead demonstrates financial impact, especially when budgets are lean. Sales cycle length from first touch to close shows where delays occur.
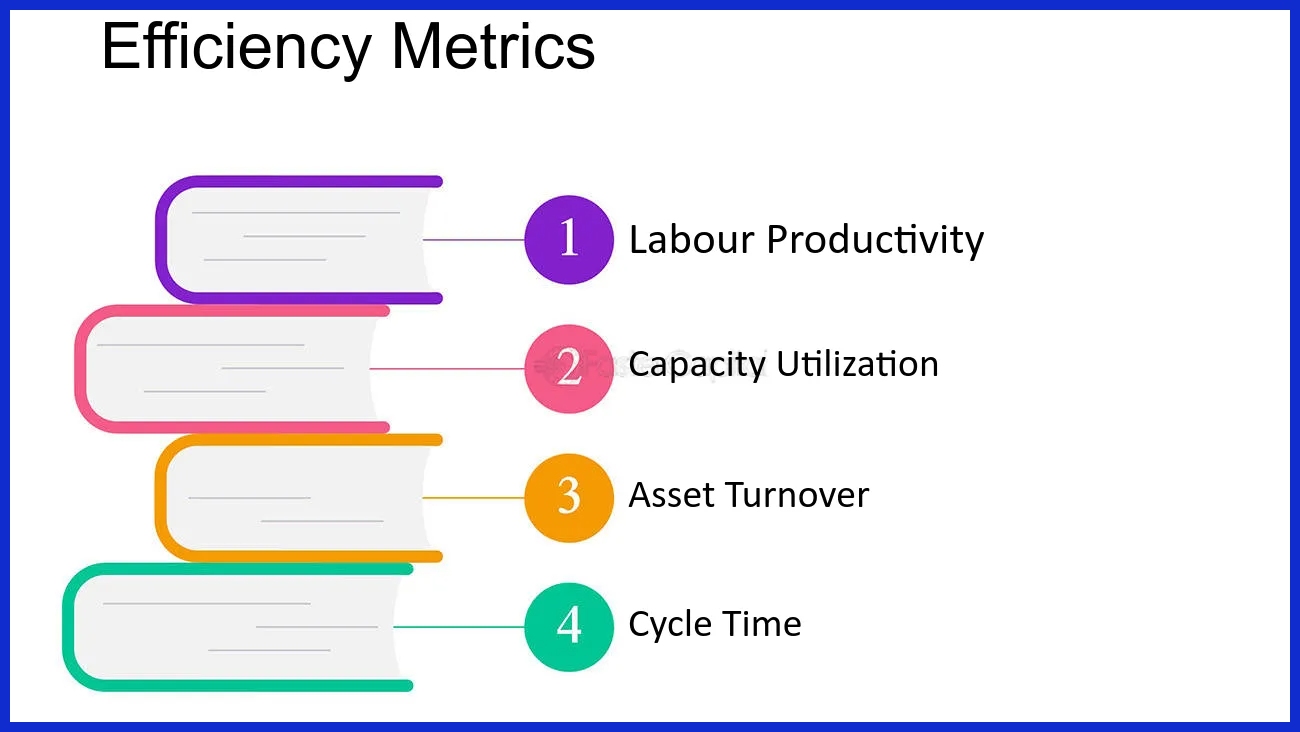
Teams examine their lead-to-sale ratio to ensure that lead generation efforts are paying off. There are automated tools that help track these metrics, which makes the process more accurate and less time-consuming.
5. Customer Metrics
Customer-centric metrics keep your team focused on long-term value. Customer satisfaction scores provide immediate data on service quality. Retention rates show you how well you retain customers.
Lifetime value indicates how much revenue each customer generates over time. By continually collecting and responding to customer input, teams can adjust their strategy and products, cultivating loyalty along the way.
Leading vs. Lagging Indicators
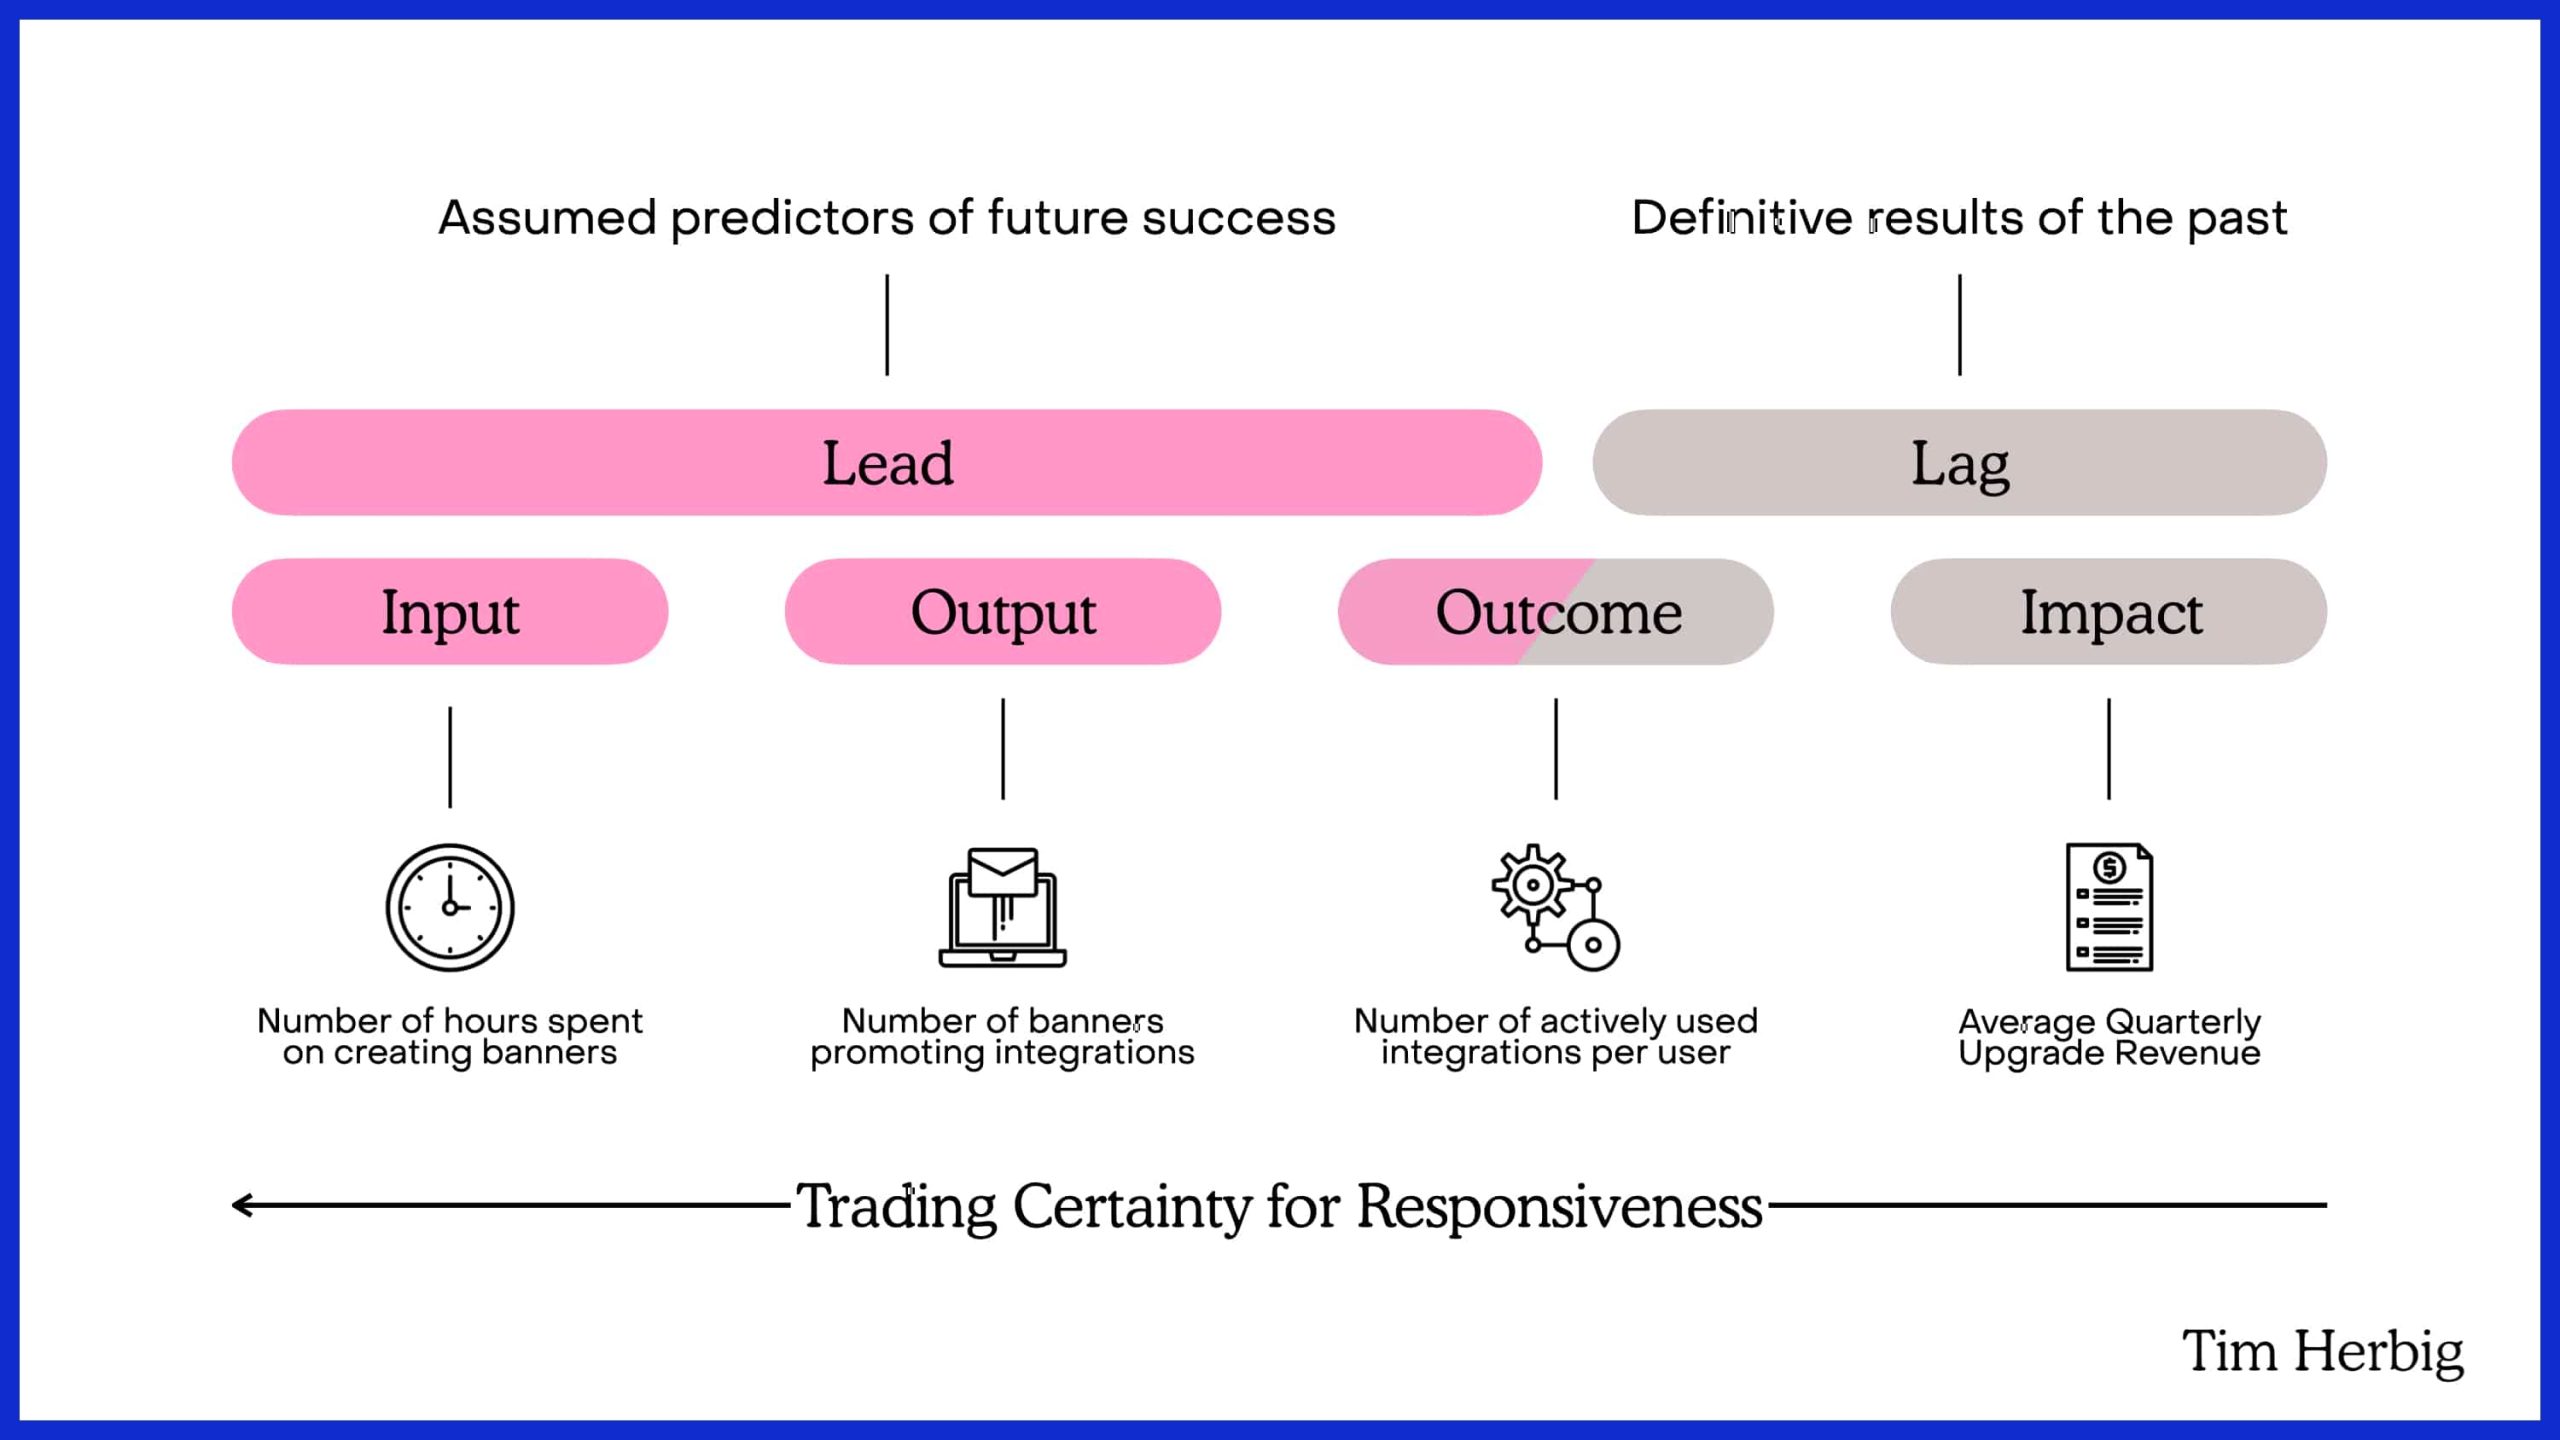
Sales metrics often fall into two types: leading indicators and lagging indicators. Leading indicators show you what’s likely to occur next in the sales process. These are the timely indicators that allow teams to identify trends early and act quickly if necessary.
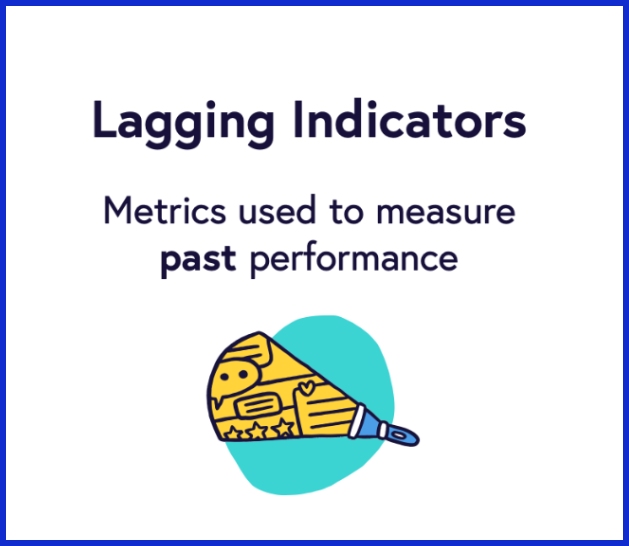
Lagging indicators provide a history of what’s already occurred. They reflect the consequence of prior decisions and enable teams to quantify how things worked out after the fact.
Leading indicators are what’s going on at this very moment. They let teams know whether their sales efforts are headed in the right direction ahead of the official results. For instance, the amount of sales calls made this week, the sales pipeline value, and the number of new meetings arranged are all leading indicators.
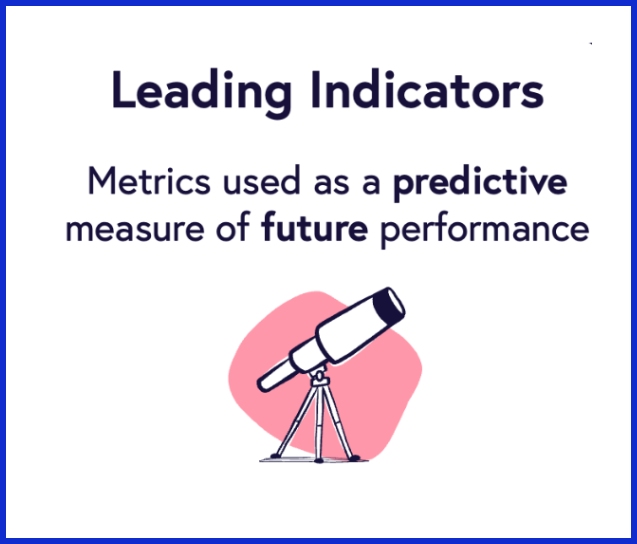
These figures can indicate a robust sales period in the future or expose areas of slowdown. Teams can use this data to detect if a sales rep requires additional support or if a specific stage in the sales pipeline is a bottleneck. If leads are moving at a slower pace from stage to stage, that’s a trigger to intervene and coach or repair the process.
Leading indicators update in real time, so teams have an opportunity to pivot while it still counts. This, in turn, makes it easier to hit targets, keep clients happy, and plan resources.
Lagging indicators are retrospective, displaying the results of previous efforts. These are things like total sales closed last month, revenue for the quarter or win rates over a given time period. They’re all important for tracking whether the team’s effort delivered and whether the sales strategy performed as intended.
Less useful in making quick fixes are what’s known as lagging indicators because they present results after the fact. Still, these numbers are worth considering to review and report. They assist teams in identifying what was successful, what wasn’t and where larger changes could be required.
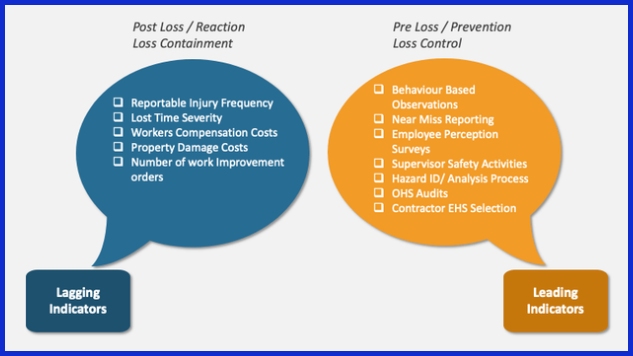
Paying attention to both types of indicators is key. Leading indicators help teams act fast and fix things before they become problems. Lagging indicators confirm whether the sales plan works and where to optimize long term.
Utilizing both provides a fuller view into sales health and empowers teams to make smart, data-informed decisions.
|
Indicator Type |
Example Metrics |
What It Shows |
When Useful |
|---|---|---|---|
|
Leading |
Calls made, meetings booked, pipeline value |
Predicts future sales, shows current activity |
Real-time, proactive |
|
Lagging |
Deals closed, revenue, win rate |
Measures past results, tracks targets met |
Retrospective, review |
Building Your Measurement Framework
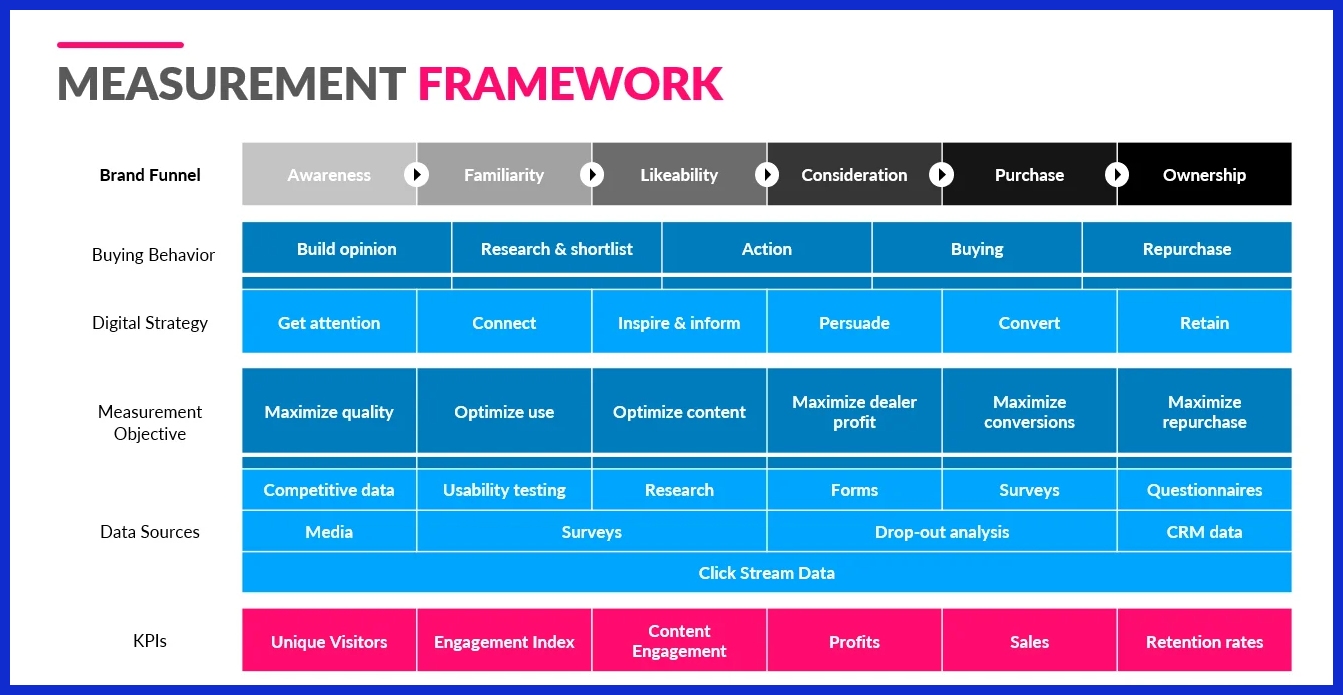
A measurement framework keeps teams on top of what’s important, identifies trends early and responds with precision. Begin with diagnosis, not data collection. Link volume, quality, efficiency and productivity measures. For most B2B teams, five to seven core metrics expose the complete sales landscape. Build these metrics into daily workflow with real-time visibility, recognition and coaching. Use this framework to bring your daily actions into alignment with your organization’s goals.
Five steps for building an effective measurement framework:
-
Define clear sales goals tied to broader strategy.
-
Select actionable, relevant metrics.
-
Choose the right tools for data collection and analysis.
-
Set a regular cadence for measurement and review.
-
Review and adapt your approach as needs change.
Define Goals
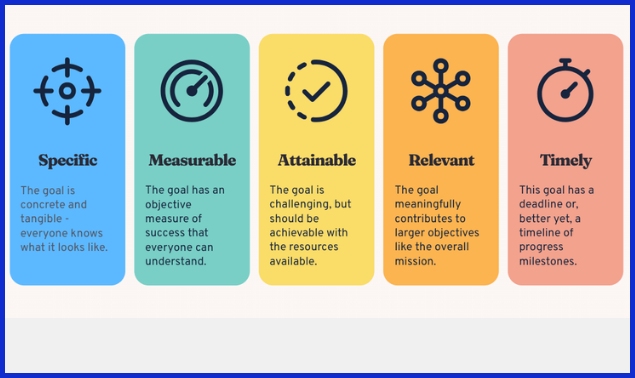
Set SMART goals — specific, measurable, achievable, relevant, and time-bound. Each objective should support a well-defined business objective. For instance, a goal could be to grow qualified leads by 20% in six months. Ensure team and individual goals back higher level organizational objectives. This gets everyone rowing in the same direction.
Explain every goal clearly so that all team members understand their role. Update targets as performance and market shifts. This keeps goals grounded and attainable.
Select Metrics
Pick metrics that align with your objectives. Concentrate on those that direct action and aid decision making, like the number of qualified leads (quantity), conversion rate (quality), sales cycle length (efficiency), and revenue per rep (productivity). Keep your core set lean, no more than five to seven metrics.
For instance, measuring both conversion rates and average deal size may indicate whether quality or price is a limiting factor. Engage your team in choosing metrics. Their involvement ensures the selected measures are logical and integrate with day-to-day tasks.
Choose Tools
Choose tools that monitor and display your metrics in real-time. Seek out software that is user-friendly, integrates with your existing software, and provides real-time access to performance metrics. Spend some time training so your team can get value out of these tools.
Periodically verify that the tools work for you as your sales process evolves. Switch or upgrade to stay ahead of your team’s expansion.
Set Cadence
Determine the frequency with which you’ll review and share metrics. Weekly or bi-weekly reviews work well for most teams, while monthly reports help spot longer trends. Use regular meetings to discuss what the numbers mean and how to get better.
If you see meetings getting off track or team enthusiasm waning, switch up the cadence. Brief, frequent check-ins change behavior faster than infrequent, long reports.
Review and Adapt
Revisit your framework frequently to determine if it’s guiding you toward your objectives. Remain adaptable and ready to adjust when new obstacles emerge or the market moves. Have your team disclose what works and what doesn’t to make everyone feel a part of it.
-
Compare current metrics to targets and past results.
-
Drop metrics that no longer give value.
-
Add new ones if business needs change.
-
Use team feedback to guide next steps.
Actionable Sales Reporting
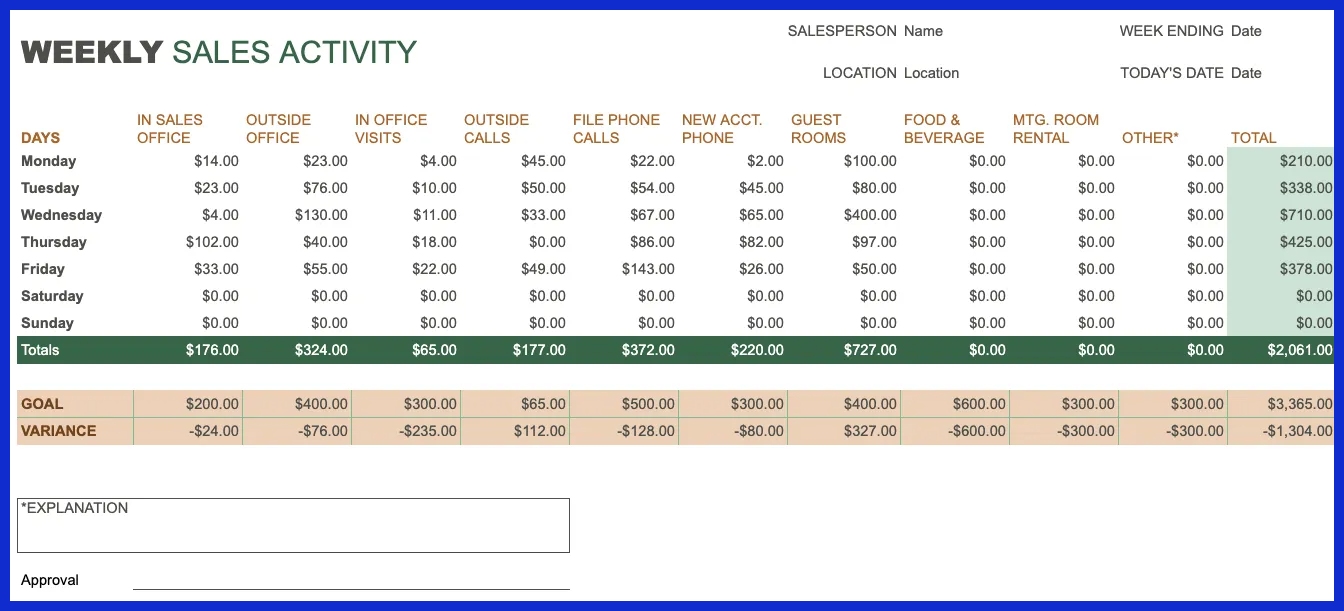
Actionable sales reporting is about creating reports that provide transparency into sales activity, why, how, and how much, and what needs to happen next. Reports should be targeted on the right sales metrics for each time period. For daily reports, log activity metrics such as calls made, emails sent, and meetings scheduled.
Weekly reports should cover movement in the sales pipeline, how deals advance from stage to stage. Monthly reports must indicate broader trends, like how close the team is to its sales goals and whether the team is ahead or behind. By utilizing these time intervals, sales teams are able to visualize the immediate victories and longer-term trends.
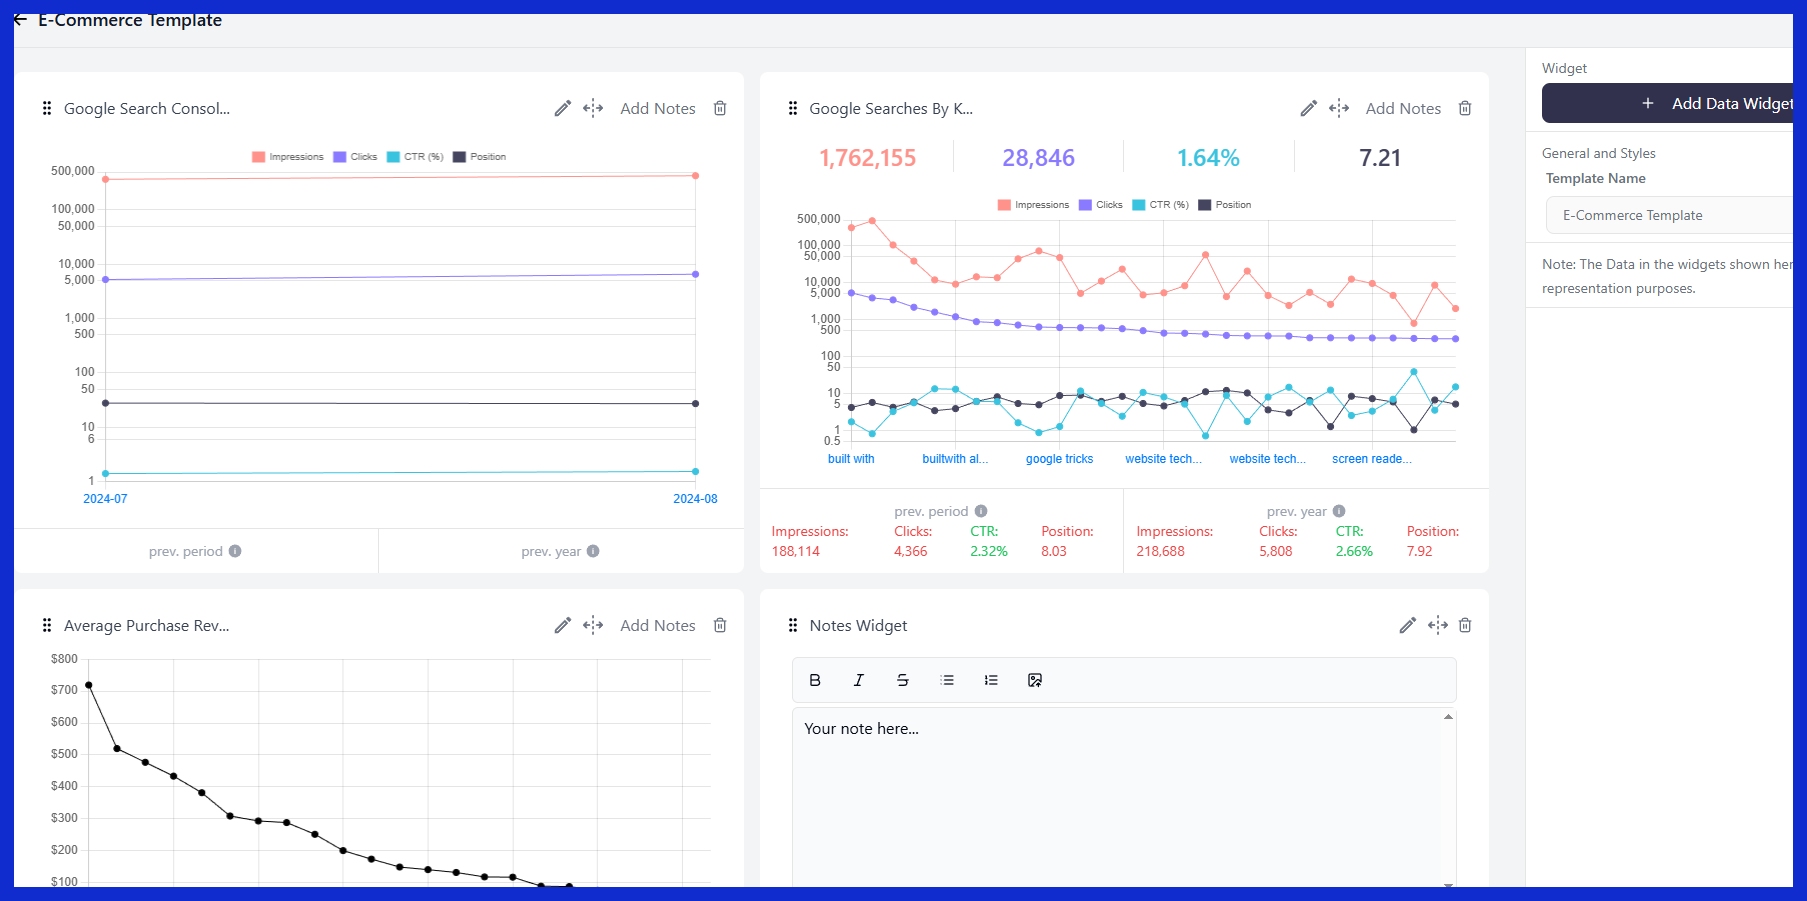
A good report is more than just a series of figures. With bar charts and line graphs, anyone can quickly identify trends or issues, regardless of their experience or position in the team. Rather than long tables crammed with raw numbers, present obvious charts that display quota attainment, which is actual bookings divided by sales quota multiplied by 100.
Quota attainment lets teams know if they are on track or missing the mark. By maintaining visuals that are simple and readable, reports remain actionable for everyone. Reports become worthless if they aren’t distributed frequently. Set a clear schedule: daily for activity metrics, weekly for pipeline updates, and monthly for overall results and trends.
That way everyone on the team is kept informed and prepared to take action. Ensure reports are delivered to shared dashboards or in automated email updates so all team members can access. Regular reporting keeps everyone focused on the right goals and avoids surprises. Sending out reports isn’t just about distributing information; it’s about enabling the entire team to be in sync.

Reports should initiate actual action, not just be glanced at and discarded. Leverage them during team meetings or planning sessions to discuss what’s working, what’s not, and what to change. For example, if the weighted pipeline calculated using deal stage probabilities demonstrates a shortfall in expected revenue, teams can shift emphasis to higher-probability deals.
If performance metrics indicate that deals get stuck at a certain stage, the team can brainstorm how to push them forward. Viewing three to six months of historical data can help identify seasonal trends and make sales forecasts more precise. Factoring in team capacity keeps goals realistic.
Conclusion
To track sales, select concrete figures that align with your objectives. Look at both the pre and post sale. Monitor metrics such as close rates, deal size, and speed to close. Use these numbers to identify weak points as well as strong points. Good sales teams rely on hard data, not just gut feel. Adjust your strategy if the math does not work out. Forget tracking every trend; track what drives your team. Great reports reveal what is working and what needs help quickly. If you want to watch your sales explode, watch the right numbers. Need insight, no hassle sales reporting? Try KPI.me to keep all your numbers in one spot and make better calls with less clutter.
Frequently Asked Questions
What are key sales metrics?
Key sales metrics are measurable data points that track sales performance. Things like total revenue, conversion rate, and average deal size. By tracking these, teams can optimize their output and achieve business goals effectively.
Why should businesses track sales metrics?
Tracking sales metrics gives you insight into what is driving revenue and what areas can be improved. It assists businesses with sales data decision-making to grow sales and increase team performance.
What is the difference between leading and lagging indicators in sales?
Leading indicators tell you what sales will look like in the future, like meetings booked. Lagging indicators indicate past outcomes, such as total sales closed. Both matter for a full picture of sales performance.
Which sales metrics are essential for most teams?
Essential sales metrics include revenue, conversion rate, sales cycle length, average deal size, and win rate. These metrics give you a clear picture of sales health and growth potential.
How can teams avoid focusing on the wrong metrics?
Binding metrics to business objectives and steering away from vanity metrics, teams should track key sales metrics. Concentrate on sales data that impacts results and informs decisions.
How often should sales reports be reviewed?
Sales reports are usually reviewed weekly or monthly. Regular reviews assist teams in identifying patterns, troubleshooting problems early, and pivoting strategies for improved outcomes.
What makes sales reporting actionable?
Actionable sales reporting highlights insights that lead to obvious next steps. It employs reliable, timely data and formats insights to facilitate informed decision-making and prompt action.