What is the Best Tool for Social Media Reports
Key Takeaways
-
Social media reports matter when it comes to monitoring strategy success, ensuring alignment with business objectives, and proving your marketing investment to stakeholders.
-
With intuitive visuals, crisp performance snapshots, and case studies, social media reports translate your results and trends to a variety of audiences and empower intelligent decision-making.
-
Actionable insights from both quantitative and qualitative feedback allow organizations to fine-tune content, boost engagement, and polish marketing strategies.
-
Time after time, auditing key metrics like audience growth, engagement rates, and paid campaign results keeps reports relevant and fuels improvement.
-
By tailoring your reports to industry, stakeholders, and internal goals, you make them impactful and relevant as possible.
-
Choosing the right reporting tool comes down to clarity about your organization’s needs, your budget, and ensuring it can scale as your activity does.
Social media reports provide a detailed look at the performance of posts, ads, and pages on various platforms. Teams utilize these reports to monitor likes, shares, clicks, and user behaviors.
With simple graphs and analytics, social media reports identify what is working and what needs to be adjusted. Reports can be shared quickly with clients or team leads.
In the following sections, learn how to construct useful reports and select the right tools for your squad.
What Are Social Media Reports?
Social media reports are standardized documents that assist teams and agencies in measuring the impact of their social media efforts during a given time frame. These reports deconstruct both what occurred and why, leveraging metrics such as engagement rate, reach, impressions, and follower growth.
A good report answers three core questions: what were the outcomes, what caused them, and what steps are next. What these reports contain and how they’re formatted can vary depending on the audience—executives want high-level summaries, marketers seek trends, and analysts require depth. Reports can be daily, weekly, or monthly with custom frequency based on business requirements.
1. Strategic Storytelling
Social media reports allow brands to craft a compelling narrative about how digital activities translate into tangible outcomes. Transforming dry data into a story brings context to what was successful and why, helping us all learn.
For instance, illustrating how an awareness campaign created a spike in engagement can tell a more complete story than data alone. These stories assist teams in connecting content decisions back to larger marketing strategies. Other agencies have case studies from reports to flaunt wins, such as a product launch that increased follower count by 15 percent in a month.
2. Performance Snapshot
A snapshot spotlights the key metrics: engagement, reach, and follower growth that matter most. Low-level charts and graphs display trends, such as if engagement spiked or dropped from last month.
This perspective makes changes easy to identify, like a drop in shares following a new posting schedule. If impressions increase but clicks fall, teams know where to focus.
3. Justifying Investment
Reports give evidence that your marketing spend adds value, leveraging data to demonstrate connections between activities and outcomes, such as increased sales or brand mentions. By capturing costs and attributing them to audience growth, marketers demonstrate how investment drives business objectives.
If a campaign lifts engagement by 20 percent and drives more visits to your site, that is obvious justification for maintaining or increasing spend.
4. Guiding Decisions
Reports provide insights that shape future plans. Teams discover what type of content receives the best response, so they can replicate more of what works.
When you compare your results with competitors, it can highlight gaps or new opportunities. Budget, timing, and content decisions all become crisper with this type of data.
Essential Report Components
A detailed social media report paints the full picture of how your social media efforts contribute to achieving business goals. All of these pieces should tie back to business goals, assisting stakeholders in deciding whether or not to take action. A template-based approach saves time and standardizes the format.
Reports for each audience—executive, marketer, or client—keep things relevant and as impactful as possible.
-
Executive summary
-
Goals and objectives (SMART)
-
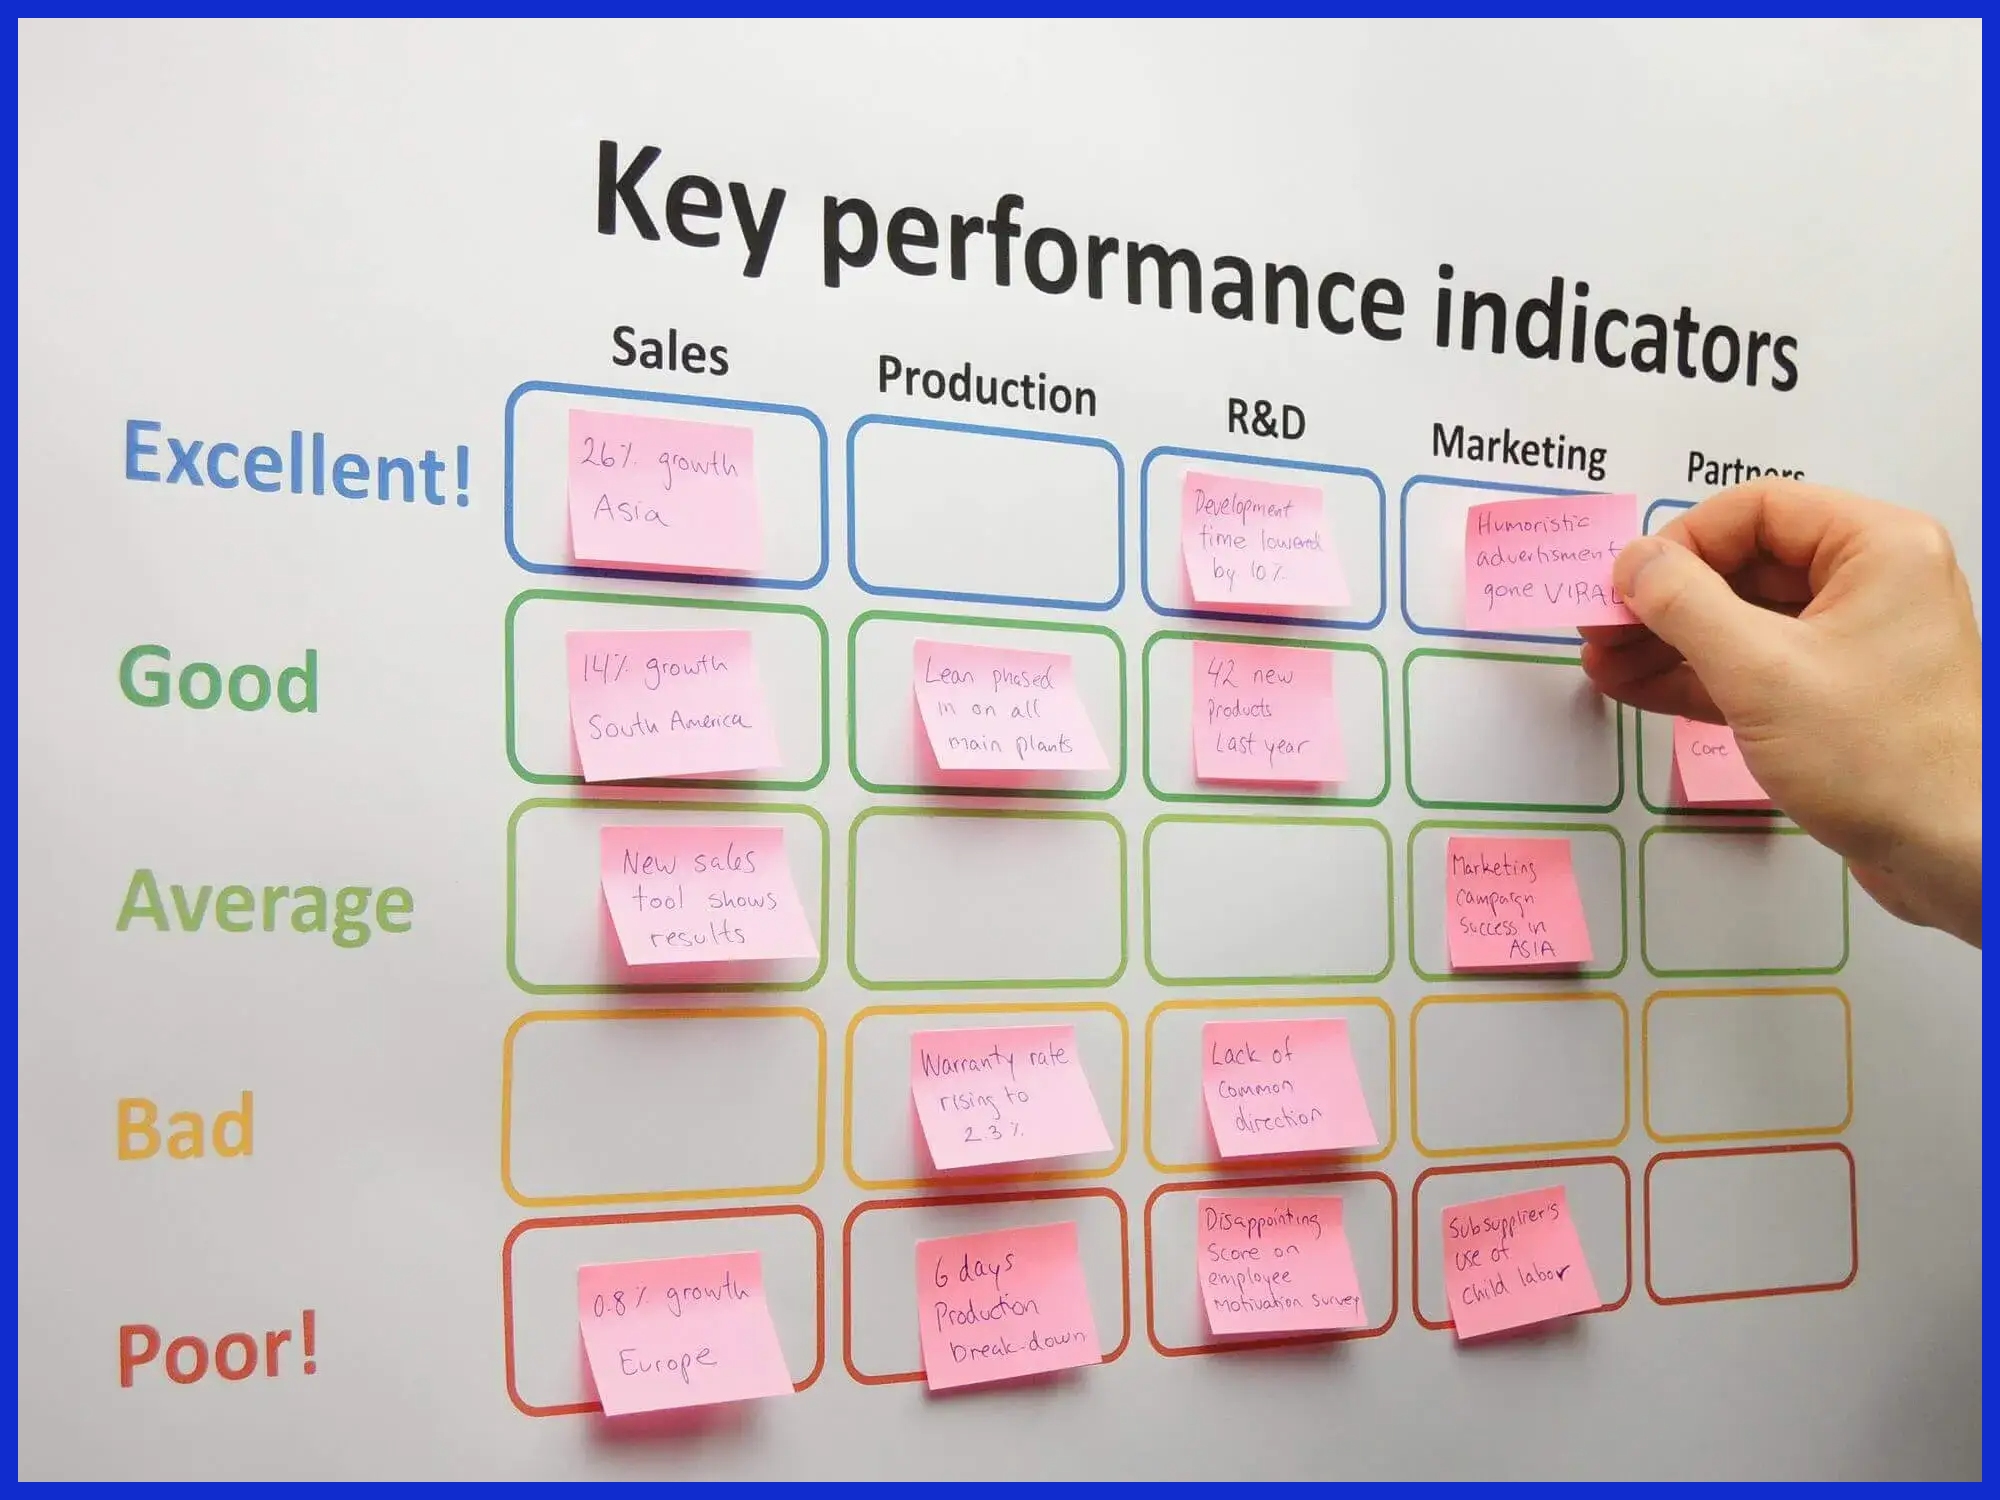
Key performance indicators (KPIs)
-
Engagement metrics
-
Follower growth
-
Content performance
-
Comparative analysis
-
Recommendations and insights
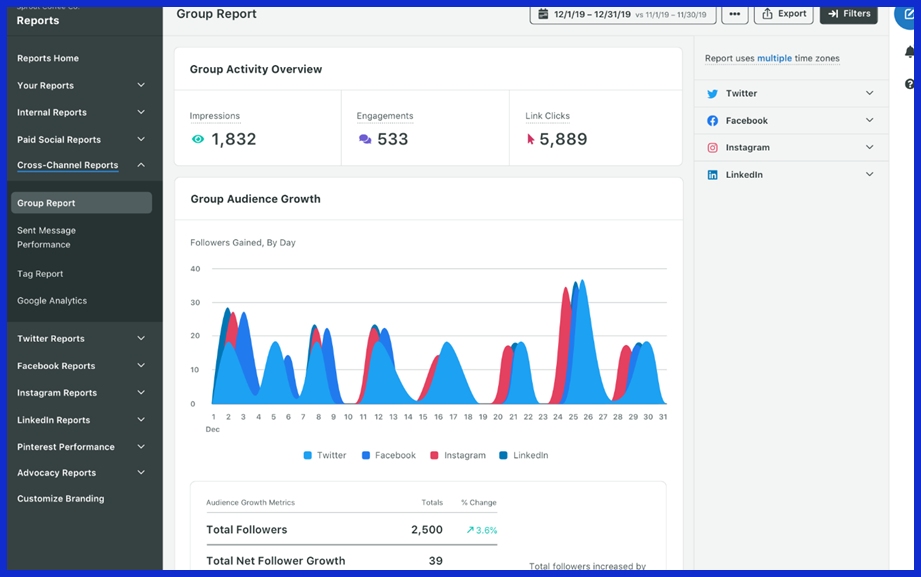
Audience Growth
Monitor follower gains on each platform to observe how the brand’s reach evolves over time. Examine audience details such as age, location, and interests to customize your content for each group.
See if new followers stick or get bored with audience engagement rates. Compare these trends with industry averages for an indication of where you stack up and where you can push harder.
Content Performance
See how all content types – images, videos, stories, short posts – do with transparent metrics. See which posts receive the most clicks, shares, or comments and use that feedback to direct future content decisions.
Engagement data tells you not only what topics resonate but what formats your audience prefers, allowing you to optimize your messaging. In time, this method allows teams to develop content that works for both brand and audience.
Engagement Rates
Engagement rates reveal how effectively your content resonates with your audience, as likes, shares, comments, and clicks contribute to the overall social media performance. By analyzing these social media metrics, you can gauge the general mood and engagement trends.
Comparisons of platform engagement are essential for understanding where your content excels or falls short, guiding your social media strategy on the optimal timing and frequency of posts for maximum impact.
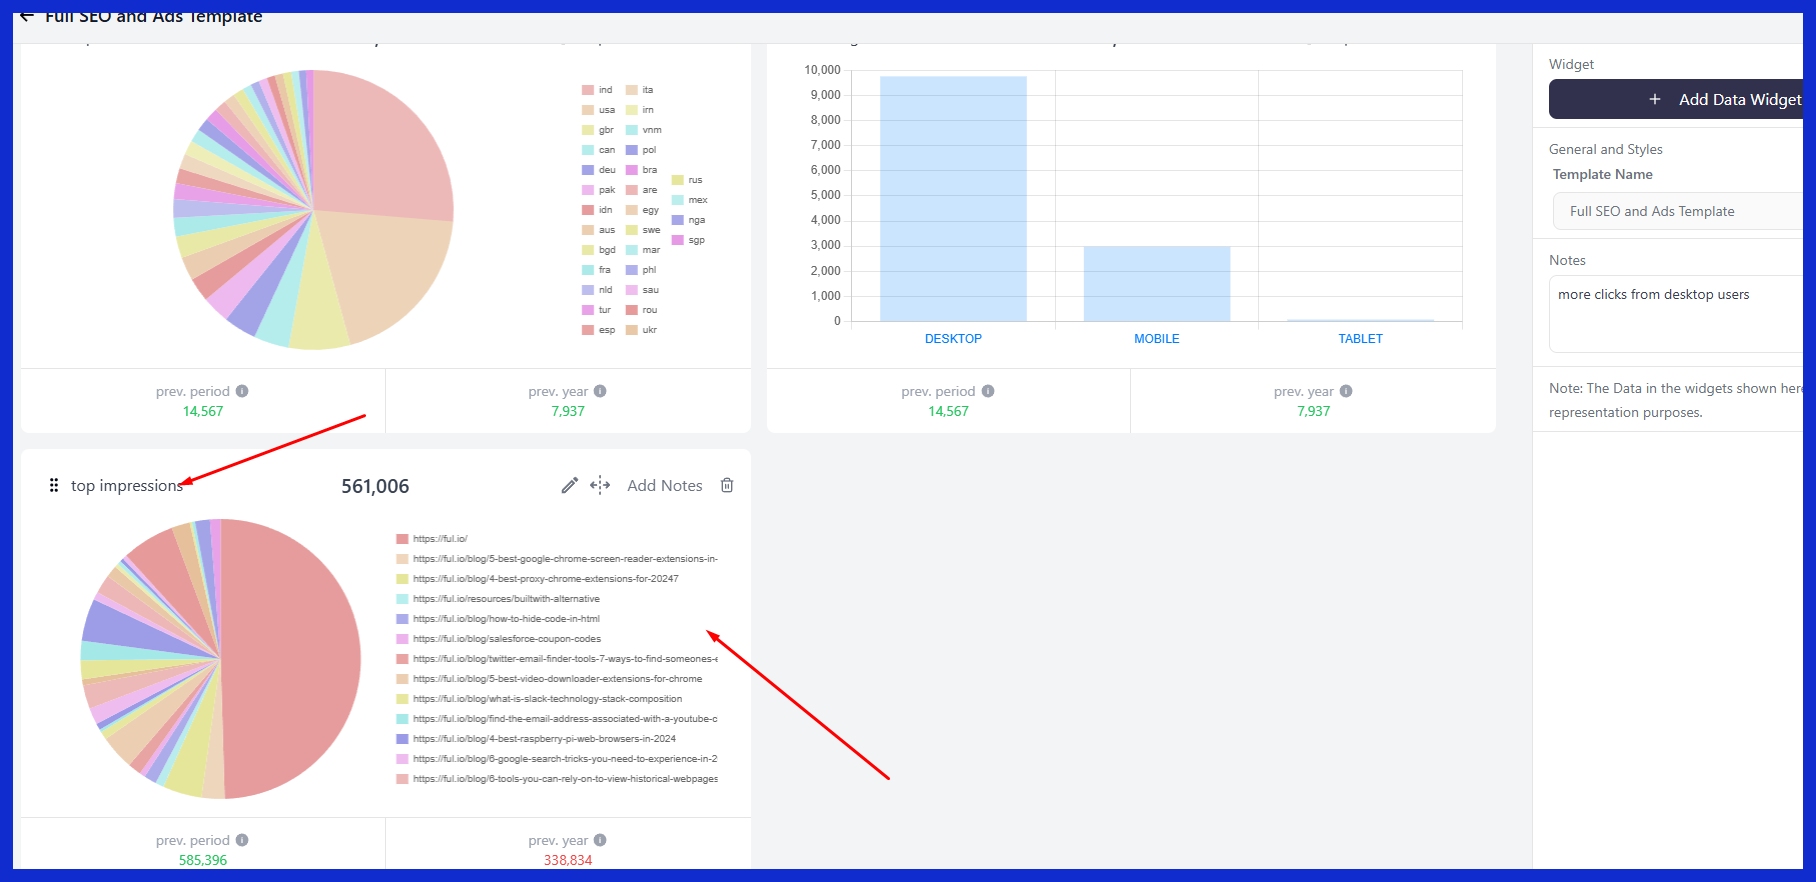
Reach and Impressions
Break out reach (unique viewers) and impressions (total) as well to help define their roles. Track these over time for a feeling of brand visibility and awareness.
Track which posts have high impressions. That indicates content that gets traction. Use reach data to identify new opportunities to engage your audience or extend your message.
Paid Metrics
Paid campaign info—such as click-through rate, CPC, and conversion—belongs in every report. Review ad metrics to determine if campaigns are on target or require adjustment.
Track spend against results and highlight value to inform future investments. Paid metrics help inform better targeting and creative decisions for more returns.
How to Craft Your Report
A good social media performance report enables teams and stakeholders to visualize what is going well and what should be altered, tying daily activity on each social network with business outcomes.
Define Goals
Define concrete goals for your report. For example, increase brand awareness, increase user engagement, or drive conversions. Link these objectives to broader business goals, such as sales increases or improved customer service.
Inform stakeholders of these goals beforehand so you are all on the same page. Review and revise goals frequently. If a platform or business priority changes, modify your goals to keep them relevant.
Select Metrics
-
Make a checklist for picking the right metrics:
-
Begin with KPIs that are important to your end users, such as reach for awareness, clicks for engagement, or sales for conversions.
-
Include content quality metrics, such as shares, comments, or saves.
-
Blend numbers, like follower growth, and feedback, like comments.
-
Check social media metrics regularly; a metric that worked last quarter may not align with new objectives.
Collect Data
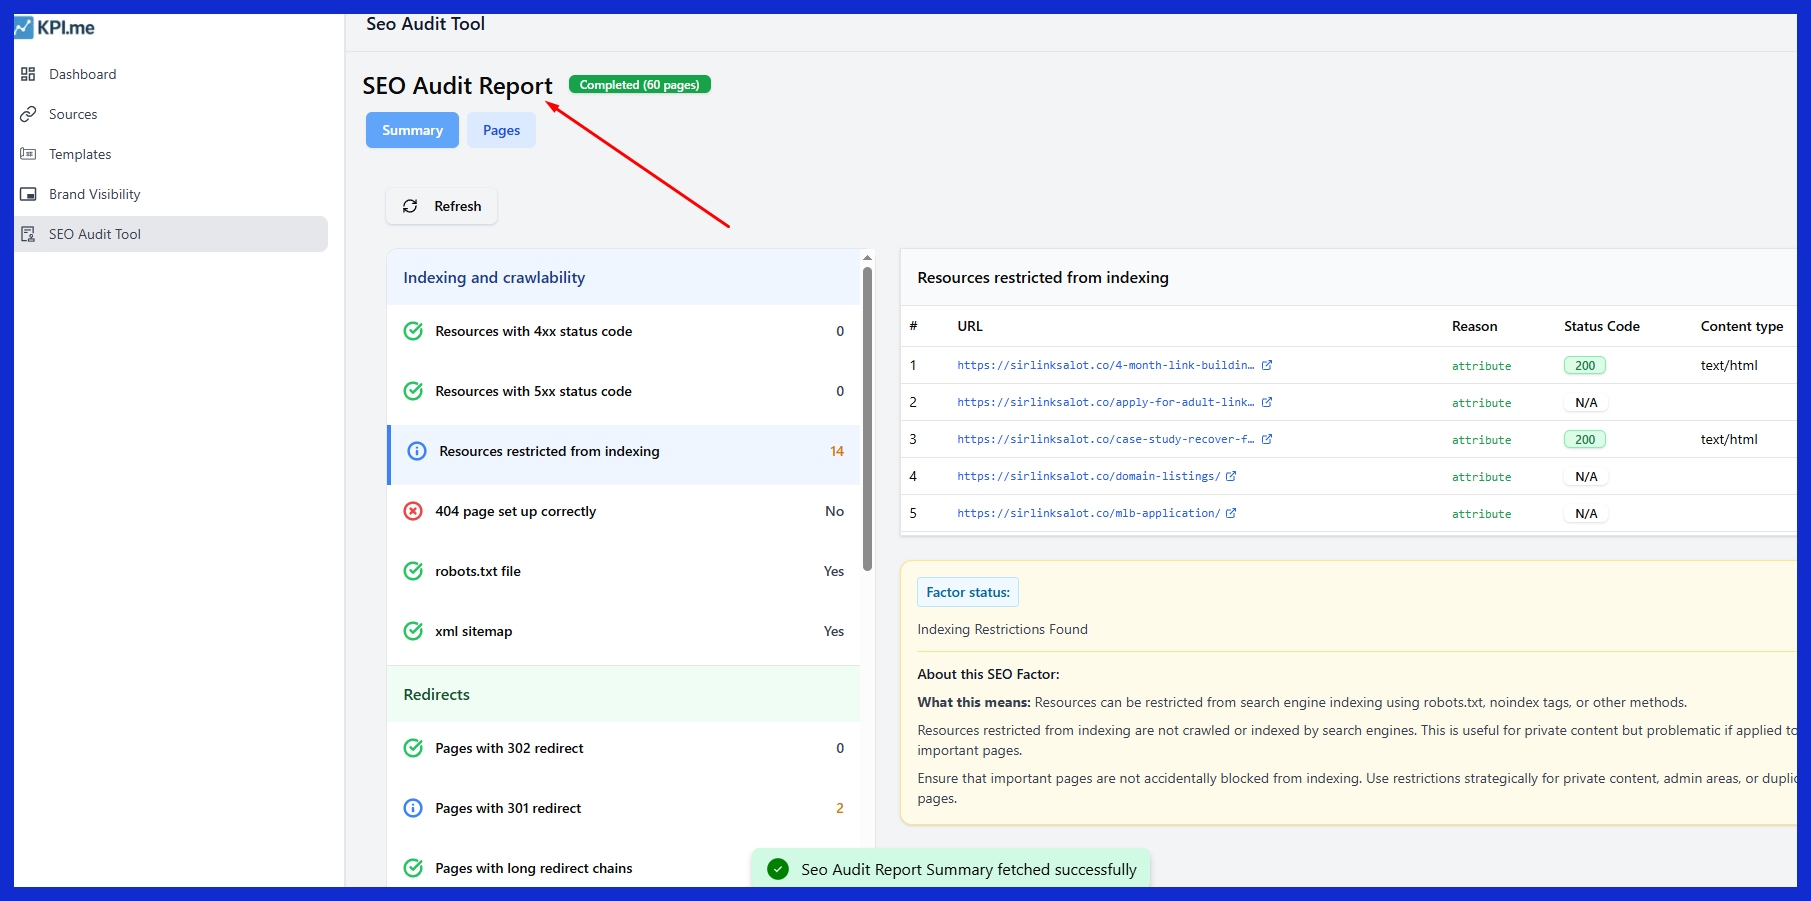
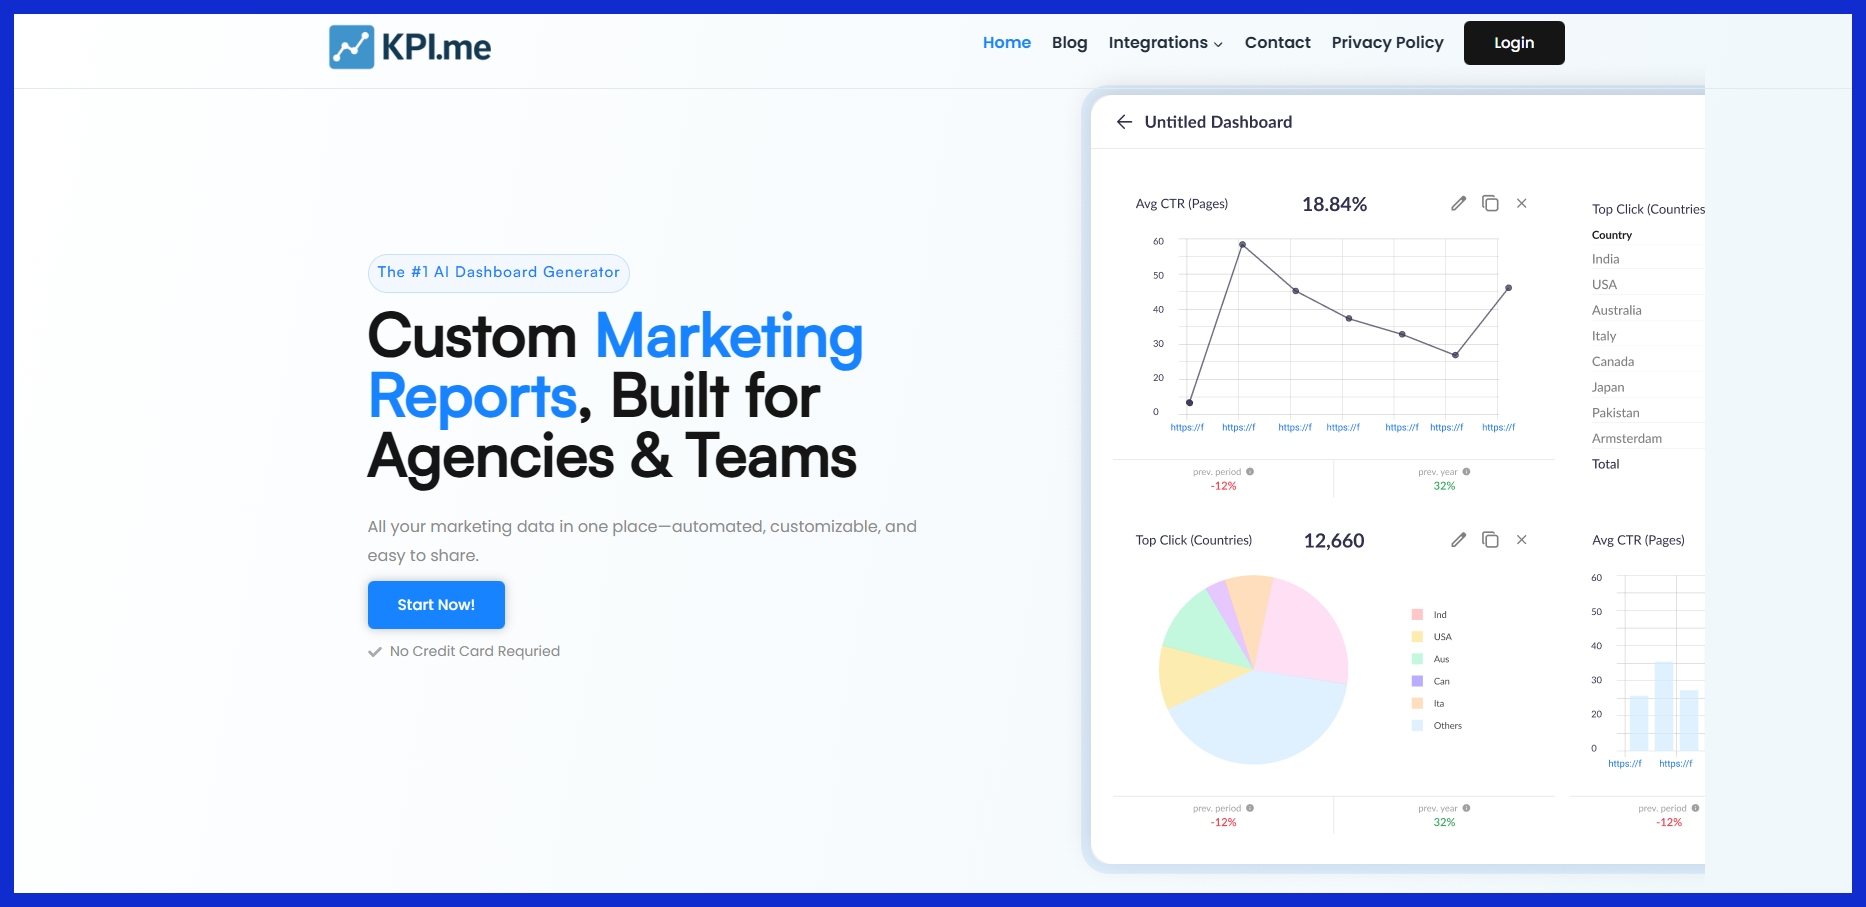
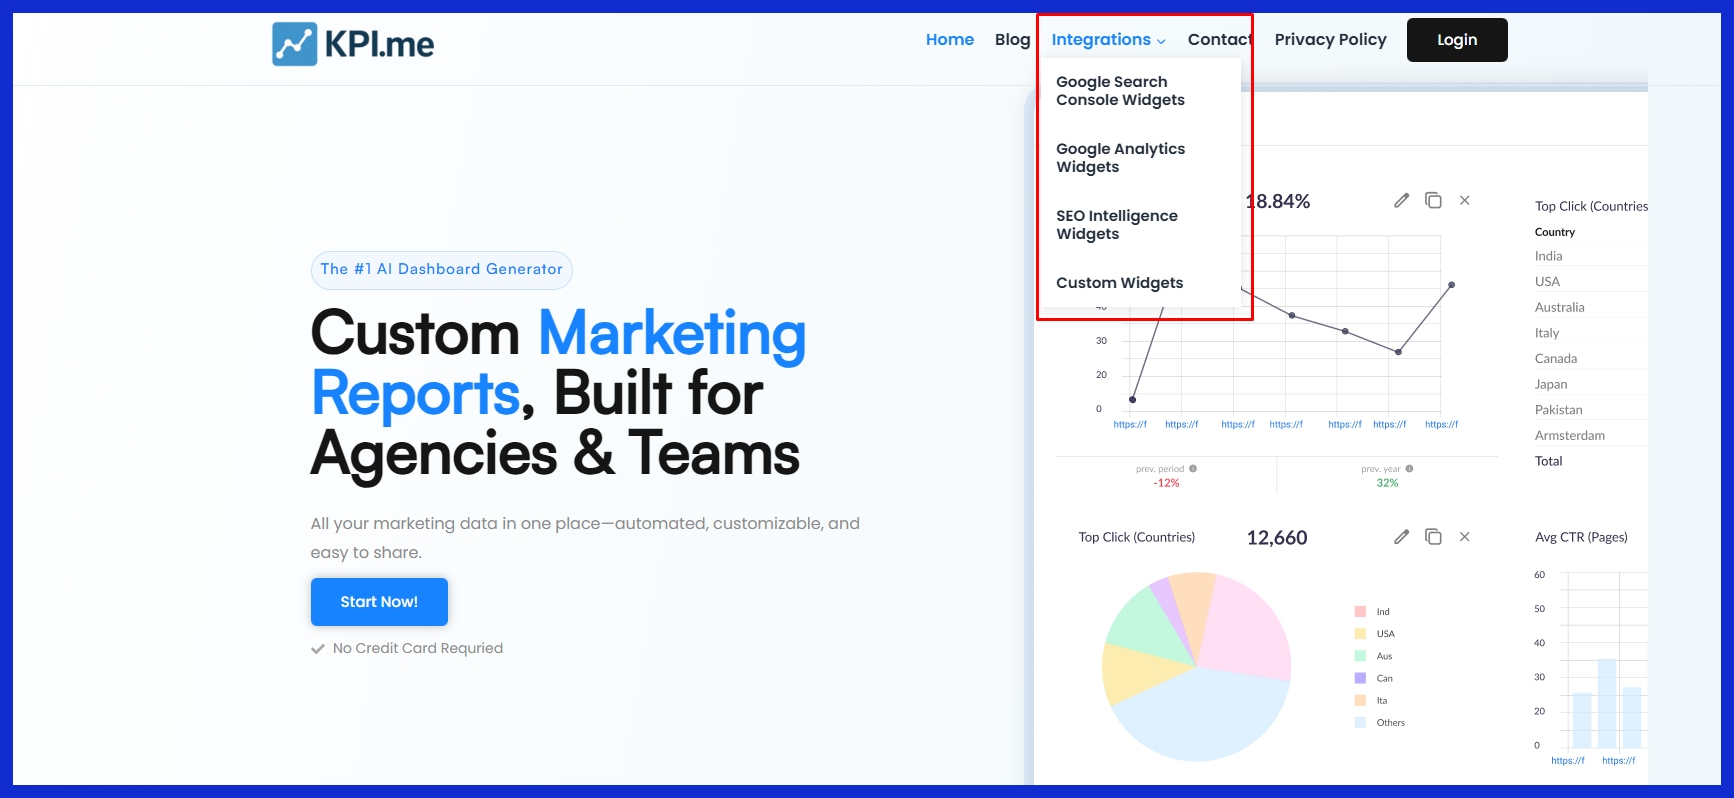
Construct a routine to collect information from every social medium. Use native tools like Instagram Insights, LinkedIn Analytics, or third-party options like KPI.me for cross-platform reporting.
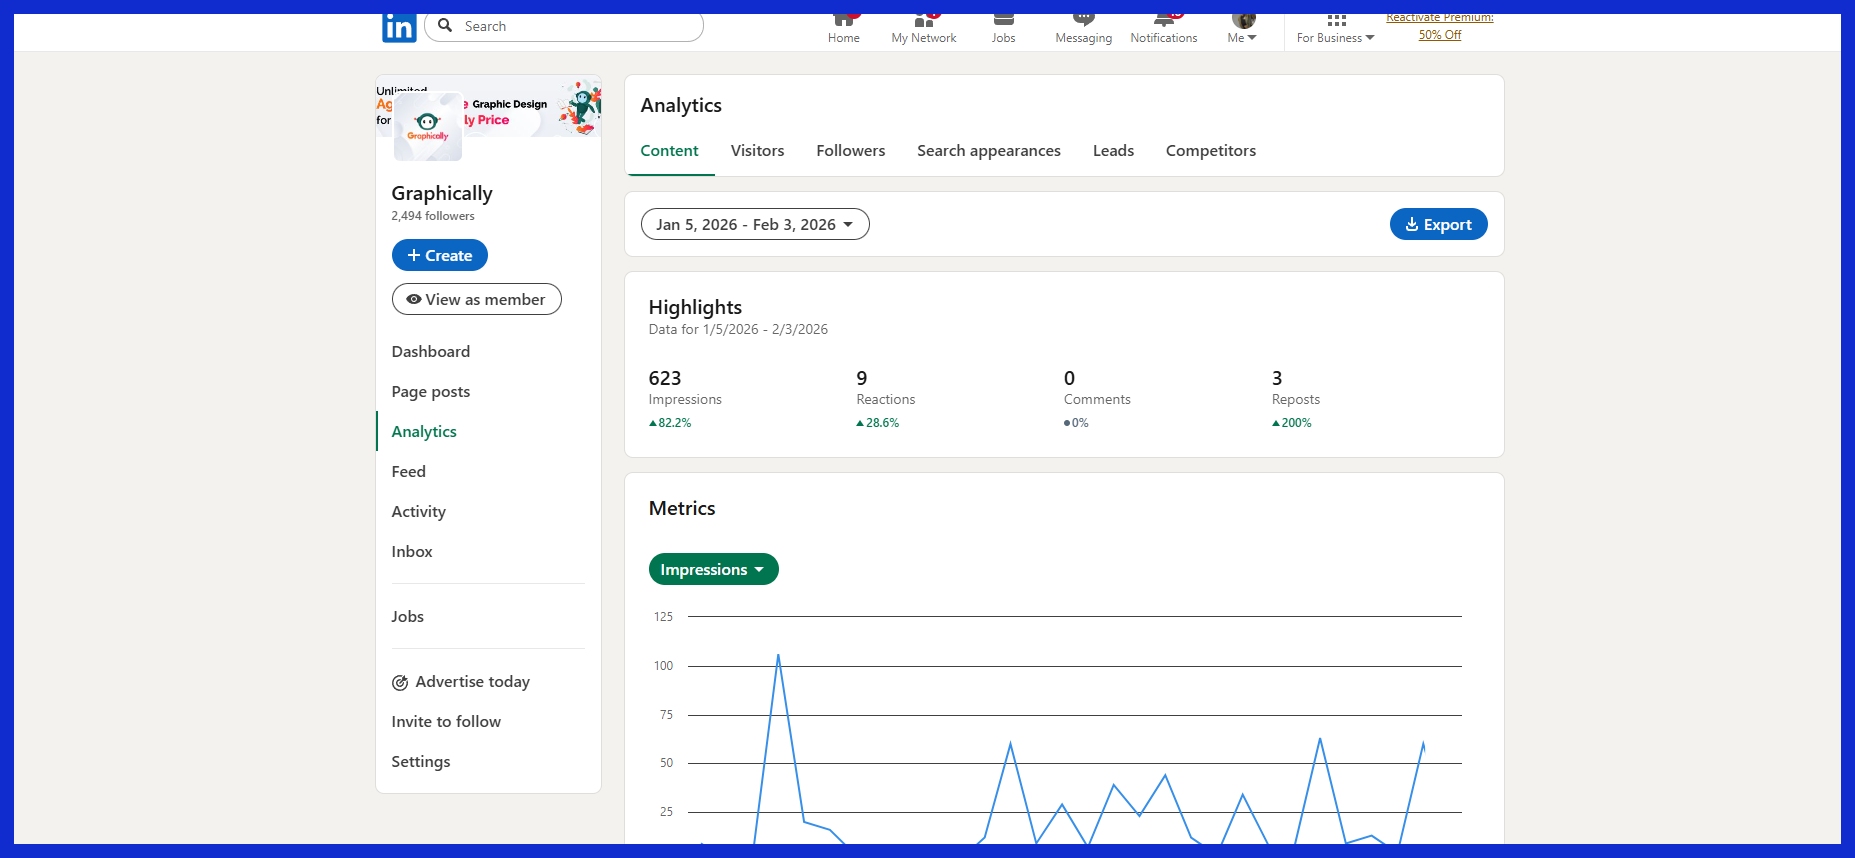
Audit sources and methods. Organize data by channel and funnel stage: awareness, engagement, and conversion to maintain clarity. This speeds up and stabilizes analysis.
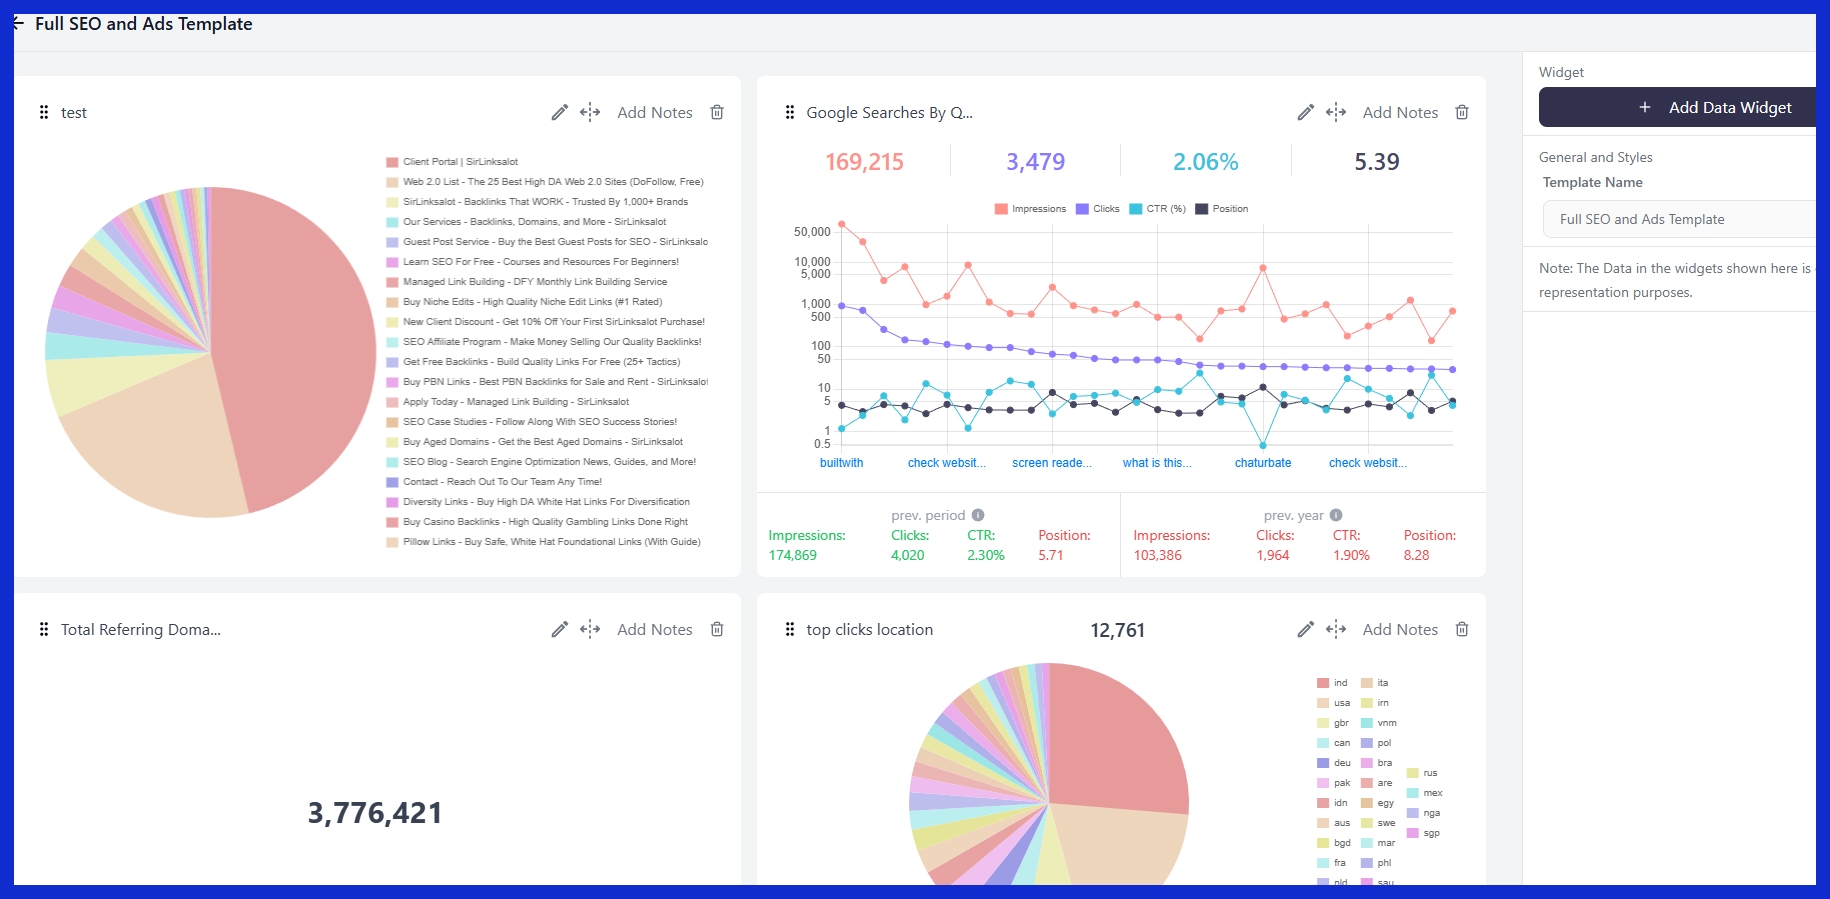
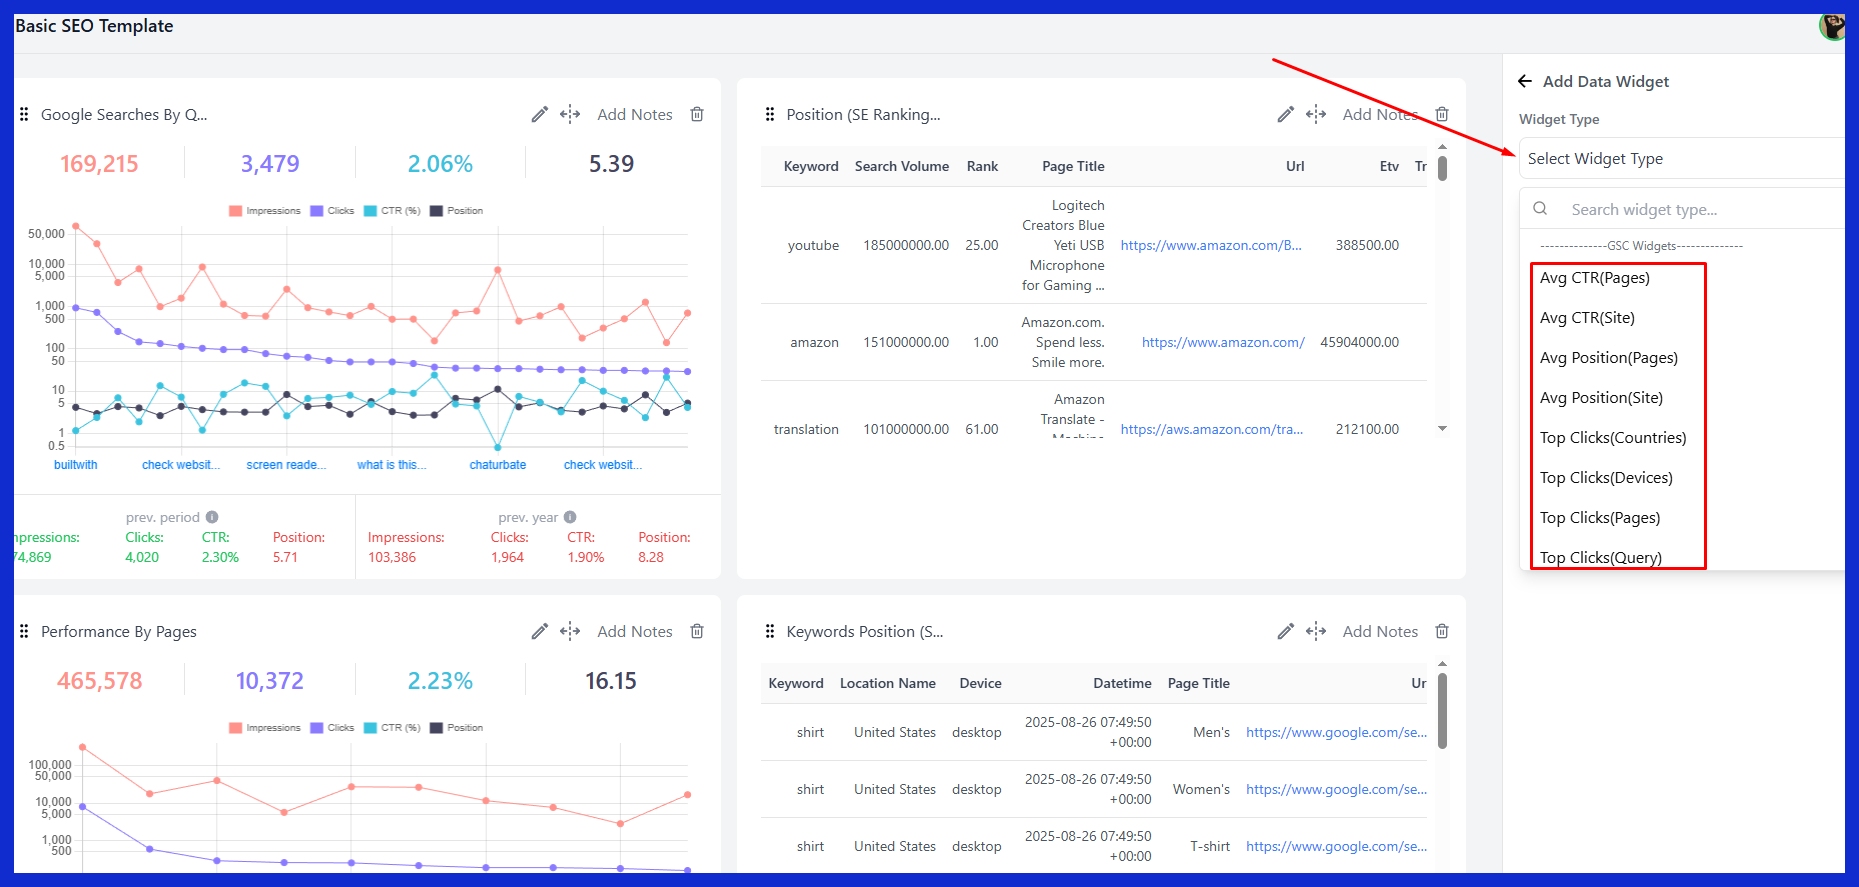
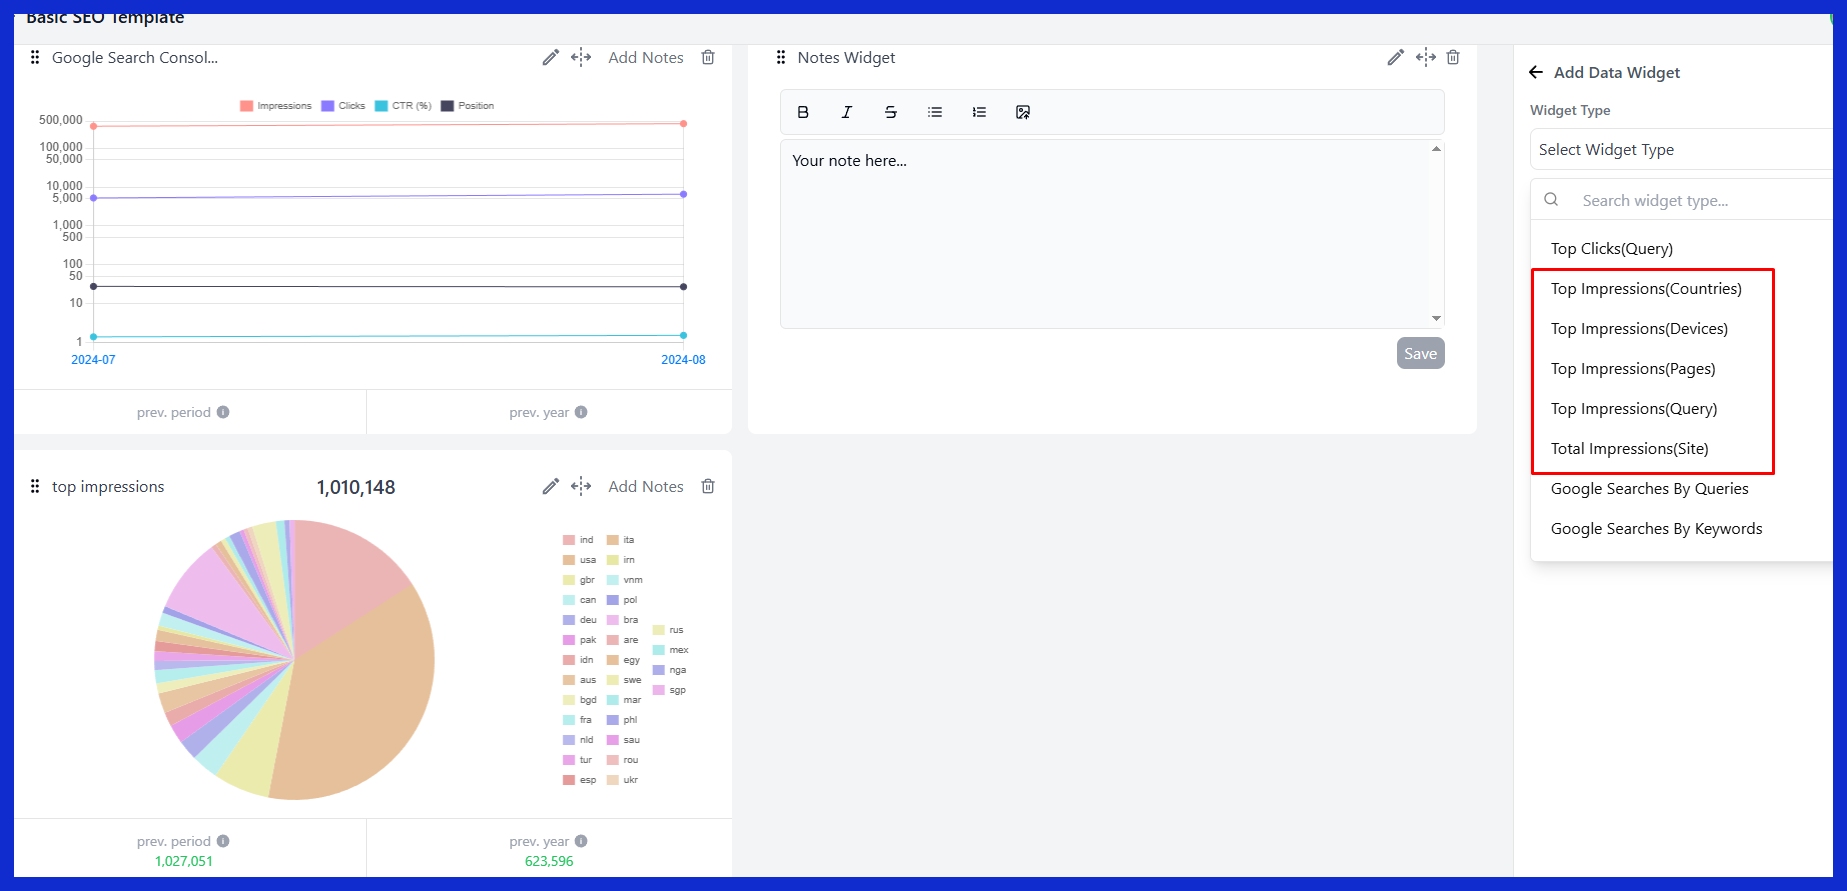
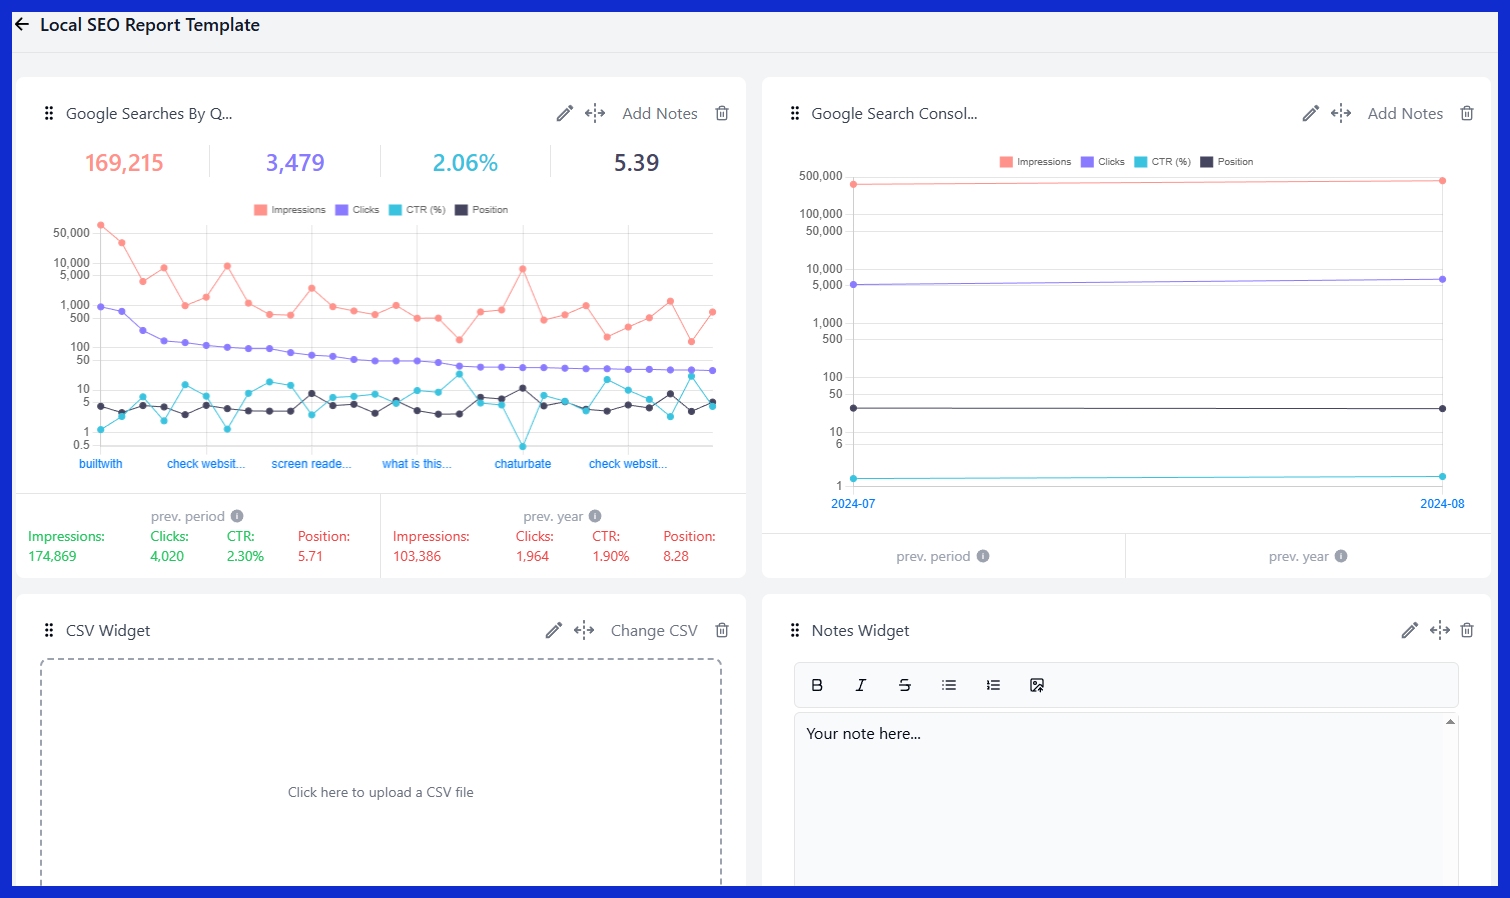
Visualize Findings
Present major findings in charts, graphs, or dashboards. Emphasize key takeaways with one-line summaries or infographics.
Tie visuals to your objectives and display a funnel chart for conversions, for instance. Dashboards provide real-time tracking for teams requiring continuous updates.
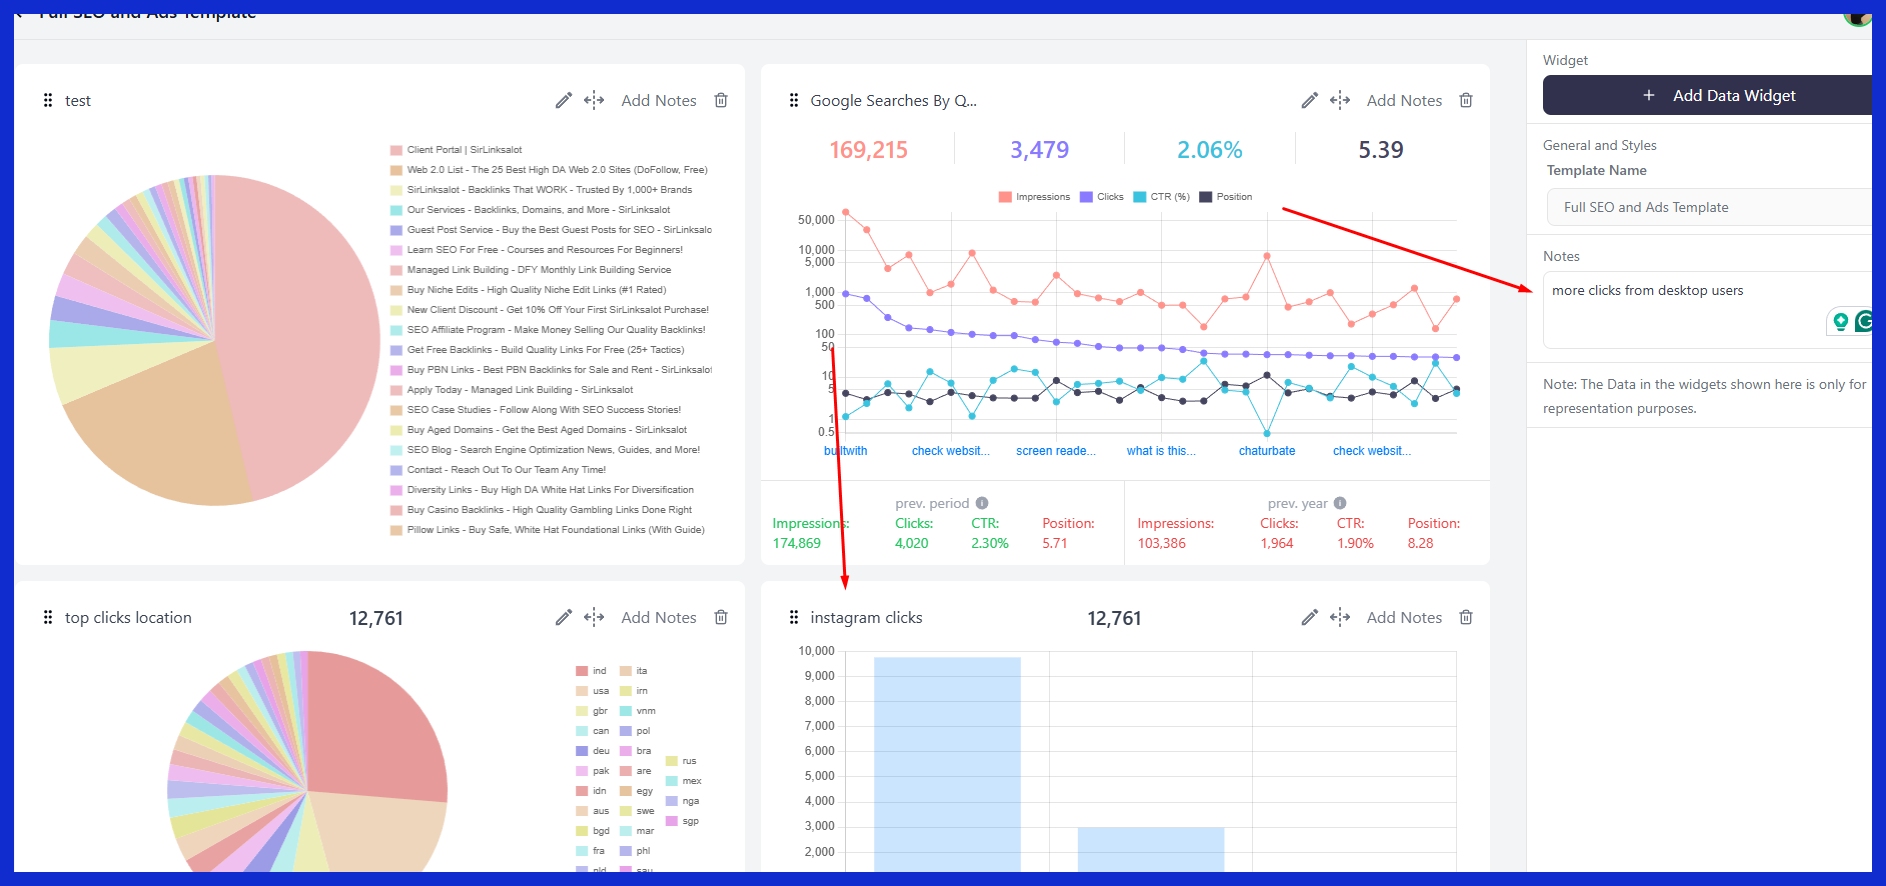
Add Insights
Take numbers and take action. Highlight trends, such as increased engagement rates following a campaign.
Recommend what to do next, such as new content formats or shifting spend. Communicate these learnings to sales, product, and care teams so that they are all moving in unison.
Interpreting Data Beyond Numbers
Social media reports are more than just numbers. They reveal how users respond, process, and behave when they encounter content. Difficult data is difficult to understand, so the trick is to make data visible. Visuals are not just decoration; they convert statistics into narratives that motivate.
About 90% of the information our brains process is visual, so charts, graphs, and maps are key to communicating insights to your team, clients, or anyone else who needs to know what is going on online. Real insight lies beneath the likes and shares. Campaign, launch, and issue reports allow teams to identify what works and what needs to change, informing decisions to be smarter and more data-driven.
Sentiment Analysis
Sentiment analysis enables brands to understand how people feel about them, not just what the numbers indicate. It tests whether comments or posts are positive, negative, or neutral, providing a very tangible feeling of the sentiment surrounding a brand.
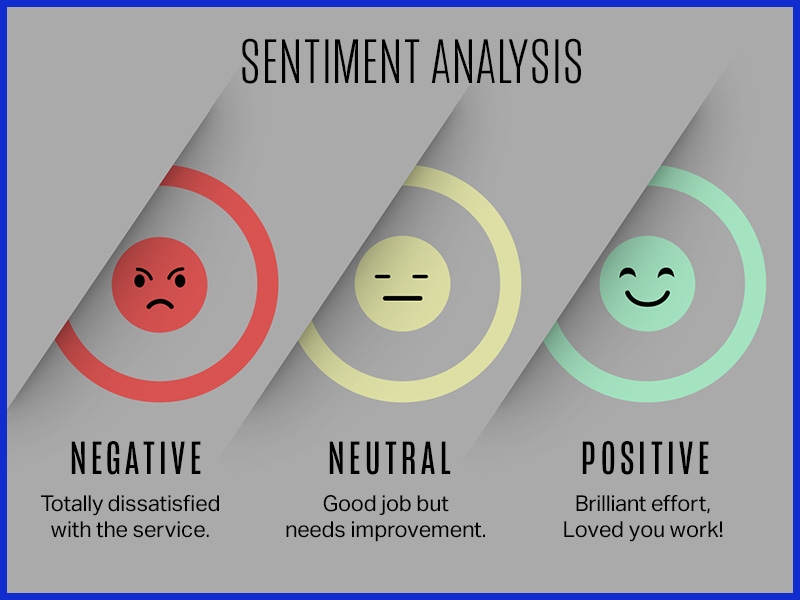
When sentiment shifts, it can indicate that something significant is occurring, perhaps a product launch succeeded or a new policy angered people. Including sentiment data in reports helps you understand why engagement increased or decreased, providing more insight than figures alone.
Algorithm Impact
Platform algorithms determine what is seen and what is missed. Brands that track these algorithms’ shifts understand why some posts succeed and others fail. Adjusting swiftly to new rules or platform shifts allows marketers to maintain visibility and engagement.
Communicating algorithm insights enables your teams and stakeholders to focus on what is most important for each channel.
Qualitative Feedback
Hearing from readers through comments, surveys, or messages brings reports to life. Their comments reveal biases and emphasize patterns that graphs ignore.
Reading what users say can expose new concepts or pain points and assist brands in tailoring content to suit needs. Adding this feedback to reports provides a more holistic and true sense of engagement.
Common Pitfalls
-
Ignoring context when looking at numbers
-
Focusing only on vanity metrics
-
Not updating reporting practices
-
Skipping regular reviews of data and process
Context is king in social media analytics. Numbers by themselves do not describe the entire narrative; missing out on details or clinging to surface metrics can overlook opportunities for actual growth.
Why Reporting Varies by Industry
Social media reporting is not generic. Every industry has its own demands, with distinct measures and benchmarks informed by rules, data types, and stakeholder expectations. What matters in e-commerce won’t always align with what’s important in B2B or for creators.
The table below provides a glimpse of how reporting varies by industry.
|
Industry |
Unique Metrics |
Reporting Frequency |
Key Stakeholders |
|---|---|---|---|
|
E-commerce |
Conversion rate, cart abandonment |
Weekly/Monthly |
Customers, investors |
|
B2B |
Lead quality, decision-maker reach |
Monthly/Quarterly |
Clients, business leads |
|
Creator |
Follower growth, engagement rate |
Weekly |
Brands, agencies |
|
Finance |
Compliance, risk alerts |
Daily/Weekly |
Regulators, investors |
|
Healthcare |
Patient privacy, compliance |
Monthly |
Regulators, patients |
|
Technology |
Innovation, R&D mentions |
Monthly/Quarterly |
Investors, partners |
|
Hospitality |
Customer satisfaction, reviews |
Weekly/Monthly |
Customers, owners |
E-commerce Focus
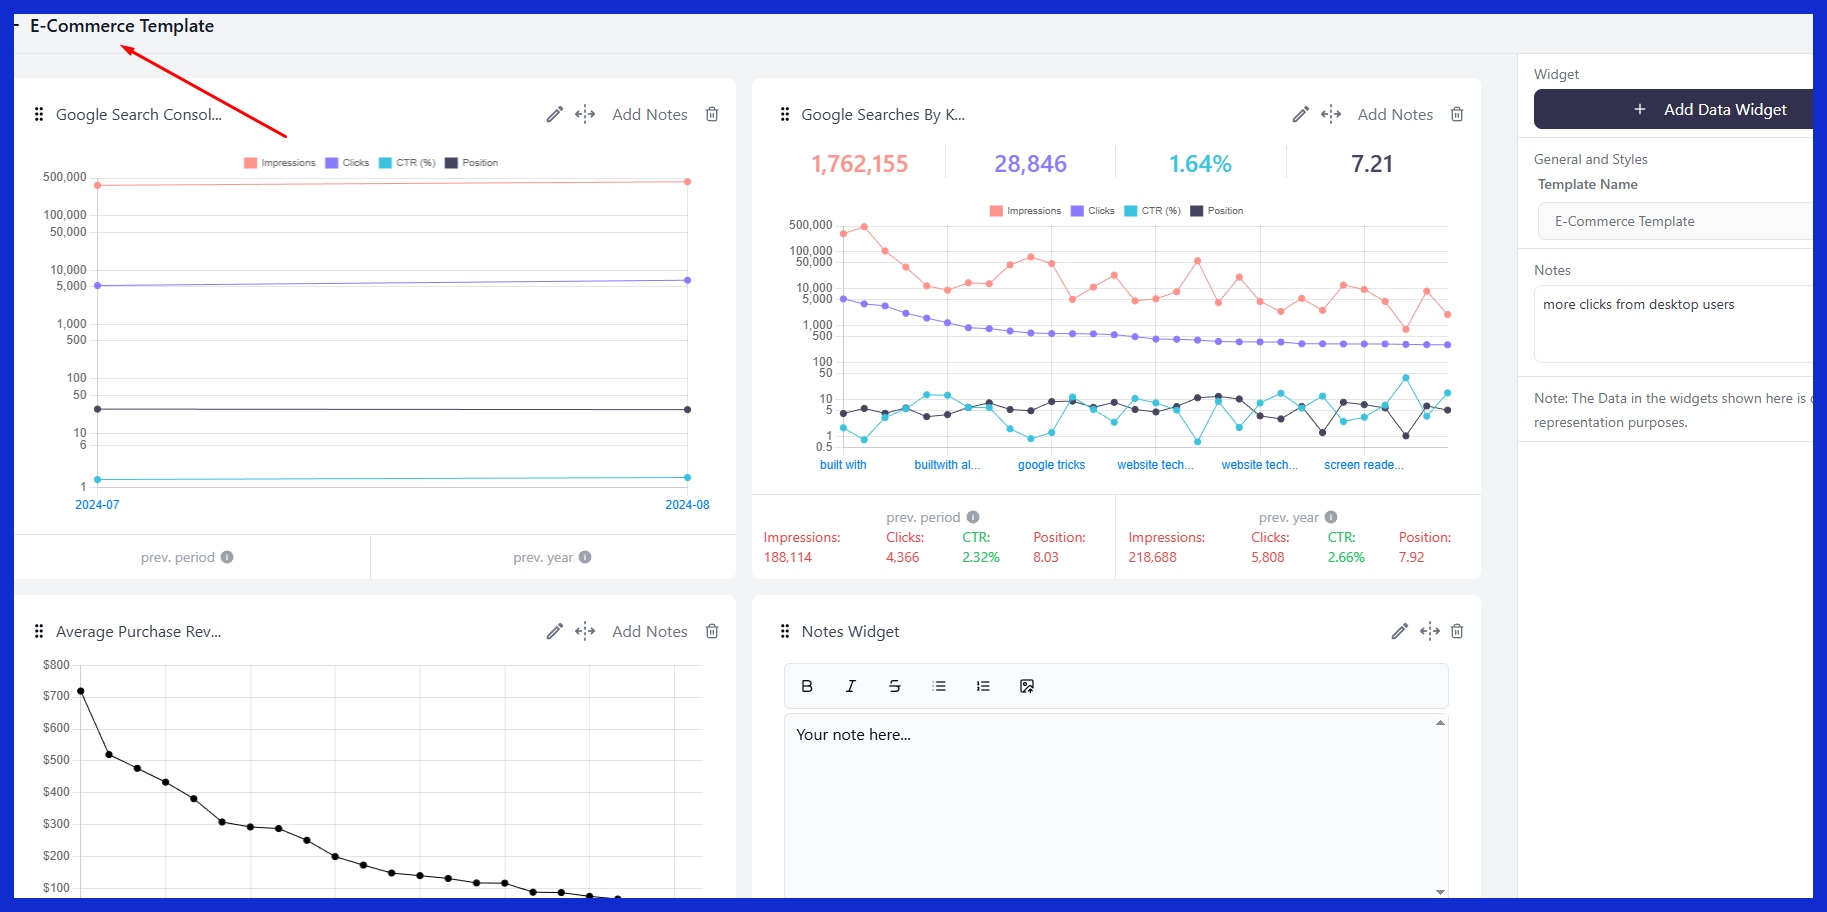
Conversion rates and customer journey metrics lie at the heart of e-commerce reporting. These figures assist brands in identifying the specific posts that generate sales, monitor the user journey from clicking to purchasing, and identify funnel leakages.
Granular tracking lets stores verify what products generate buzz and what posts convert to more revenue. When engagement spikes but sales lag, it’s a sign to tweak messaging or rethink a campaign. Data from these reports inform product launch shifts and ad spend and targeting for better returns.
B2B Focus
B2B teams love leads most. Reports track how social channels assist in locating new prospects and indicate which posts attract real interest from decision-makers.
Interaction with thought leadership, such as whitepapers or case studies, can indicate whether a brand’s voice is trusted in its industry. By seeing who clicks on content, agencies can adapt targeting to reach the appropriate buyers. Insights assist teams in demonstrating value to clients and refining outreach tactics, cultivating closer business relationships as time goes on.
Creator Focus
For makers, engagement and content reach dominate the list of essential metrics. Partner brands want to see hard numbers—think post saves, shares, and direct feedback—to determine if a collaboration is worth it.
Tracking works best when creators track both short-term bursts of attention and long-term patterns of follower growth. Reports highlight what sort of content and partnerships generate positive responses, helping tailor future collaborations and enhance value for everyone.
How to Select a Reporting Tool
Selecting a social media analytics tool is about balancing a lot of different considerations. The right tool aligns with your objectives, suits your process, and scales with you. Try stuff out, particularly during crunch time, to see if they hold up to actual work. Always seek free trials or demos before deciding.
Your Needs
Each team has its own reporting requirements. Some track daily engagement, while others want monthly trends. If real-time data is king for your campaigns, see whether the tool refreshes dashboards rapidly. For results-driven teams, a reporting tool that displays the past 30 days is more illuminating than one fixed on a week.
Consider what KPIs are important, including engagement rate, number of posts, likes, comments, and follower growth. Most tools provide these, but their presentation and data export options differ. Teams with special workflows may require custom report templates or adaptable data exports.
Your Budget
Budget carves your shortlist quickly. Prices can get higher if you have a lot of channels or require additional users. Some tools have straightforward plans, others introduce charges as you grow. Compare what you pay with what you get.
Are core features, like automated email reports or client dashboards, included or do they require an upgrade? Maintenance and updates can add up, too, as can support. For smaller teams or solo marketers, no-cost and low-cost options exist that could address all of the foundations, but without the more sophisticated analytics or automation.
Your Scale
How big your social media work is dictates the tool you require. Monitoring only two accounts is not the same as monitoring a dozen across world markets. A nice tool will take care of what you need today, but have some breathing room to grow.
That is supporting more accounts, higher data loads and more users without stalling. Before you choose a tool, try it during your peak time. Ensure it doesn’t lag or drop data. Hunt for reporting tools that are automated and easy to share for teams and clients.
Robust support is critical. If something goes down, you want a fast response, not a slow response.
Conclusion
Social media reports are most effective when they demonstrate obvious victories, deficiencies, and patterns. Good reports keep it simple and accessible for any team to leverage. Numbers narrate, but actual utility comes from candid feedback and clever adjustment. Choosing the appropriate tools can save time and reduce stress. A few brands require daily reporting, while others monitor major movements over the course of several months. For hectic agencies and teams, solutions such as KPI.me place all the critical data in a single place. To maintain your competitive advantage, experiment with innovative approaches to monitor, demonstrate, and distribute what’s most important. Give your team the insights they need to move quickly. Try constructing your next social media report with tools that match your style and pace.
Frequently Asked Questions
What is a social media report?
A social media performance report displays statistics and analysis from social media content, supporting the monitoring of performance, audience engagement, and campaign results.
Which metrics should be included in a social media report?
Incorporate statistics such as reach, engagement metrics, follower growth, click-throughs, and conversions for your social media performance report.
How often should I create social media reports?
Many businesses create monthly social media performance reports, as the frequency of reporting depends on their specific needs and campaign timelines.
Why do social media reports vary by industry?
Each industry has different objectives and audiences, which implies that social media performance metrics and report formats will vary.
What tools are best for creating social media reports?
Common tools for social media reporting include Hootsuite, Sprout Social, and Google Data Studio, which help analyze social media performance.
How can I interpret data beyond the numbers?
Notice trends, patterns, and audience responses through social media analytics for a sharper image.
Why is it important to customize social media reports?
Personalizing social media performance reports makes them meaningful to your objectives and audience. It helps you focus on what is most important for your business.