What is a Good Churn Rate? Here’s What You Need to Know
Key Takeaways
-
What is a good churn rate? It varies based on industry, business model, and company stage, but most mature companies target a churn rate of 5 to 7 percent annually.
-
Monitoring customer and revenue churn side by side on a regular basis enables businesses to spot trends and take proactive measures based on both metrics to increase retention.
-
Excessive churn rates affect profitability, boost operational expenses, and hurt long-term brand equity.
-
Typical churn drivers are bad customer service, misunderstanding of expectations, onboarding challenges, and outside market forces.
-
Churn optimization involves proactive engagement, onboarding, pricing, and customer feedback.
-
Tracking other metrics like lifetime value and net revenue retention gives you a better sense of customer health and business health.
Good churn rate refers to the percentage of users who cease using a service, which ideally is low, typically below 5% per month for SaaS companies.
Lower churn means high customer retention and stable growth. High churn indicates issues with value, support, or product fit.
Small teams and agencies monitor churn to schedule sales and identify risks. To prove what works, the following sections dissect churn benchmarks and strategies for retaining users.
What is a Good Churn Rate?
Customer churn rate refers to the percentage of customers who cease using a service within a given time period. A “good” churn rate really depends on your company’s industry, product type, and customer engagement. An annual churn rate of 5 to 7 percent is a good mark in most mature companies.
A few hyper-growth SaaS firms can even go lower, below 5 percent a year. Startups might experience churn of 10 to 15 percent in their first year as they refine their products and procedures.
1. By Industry
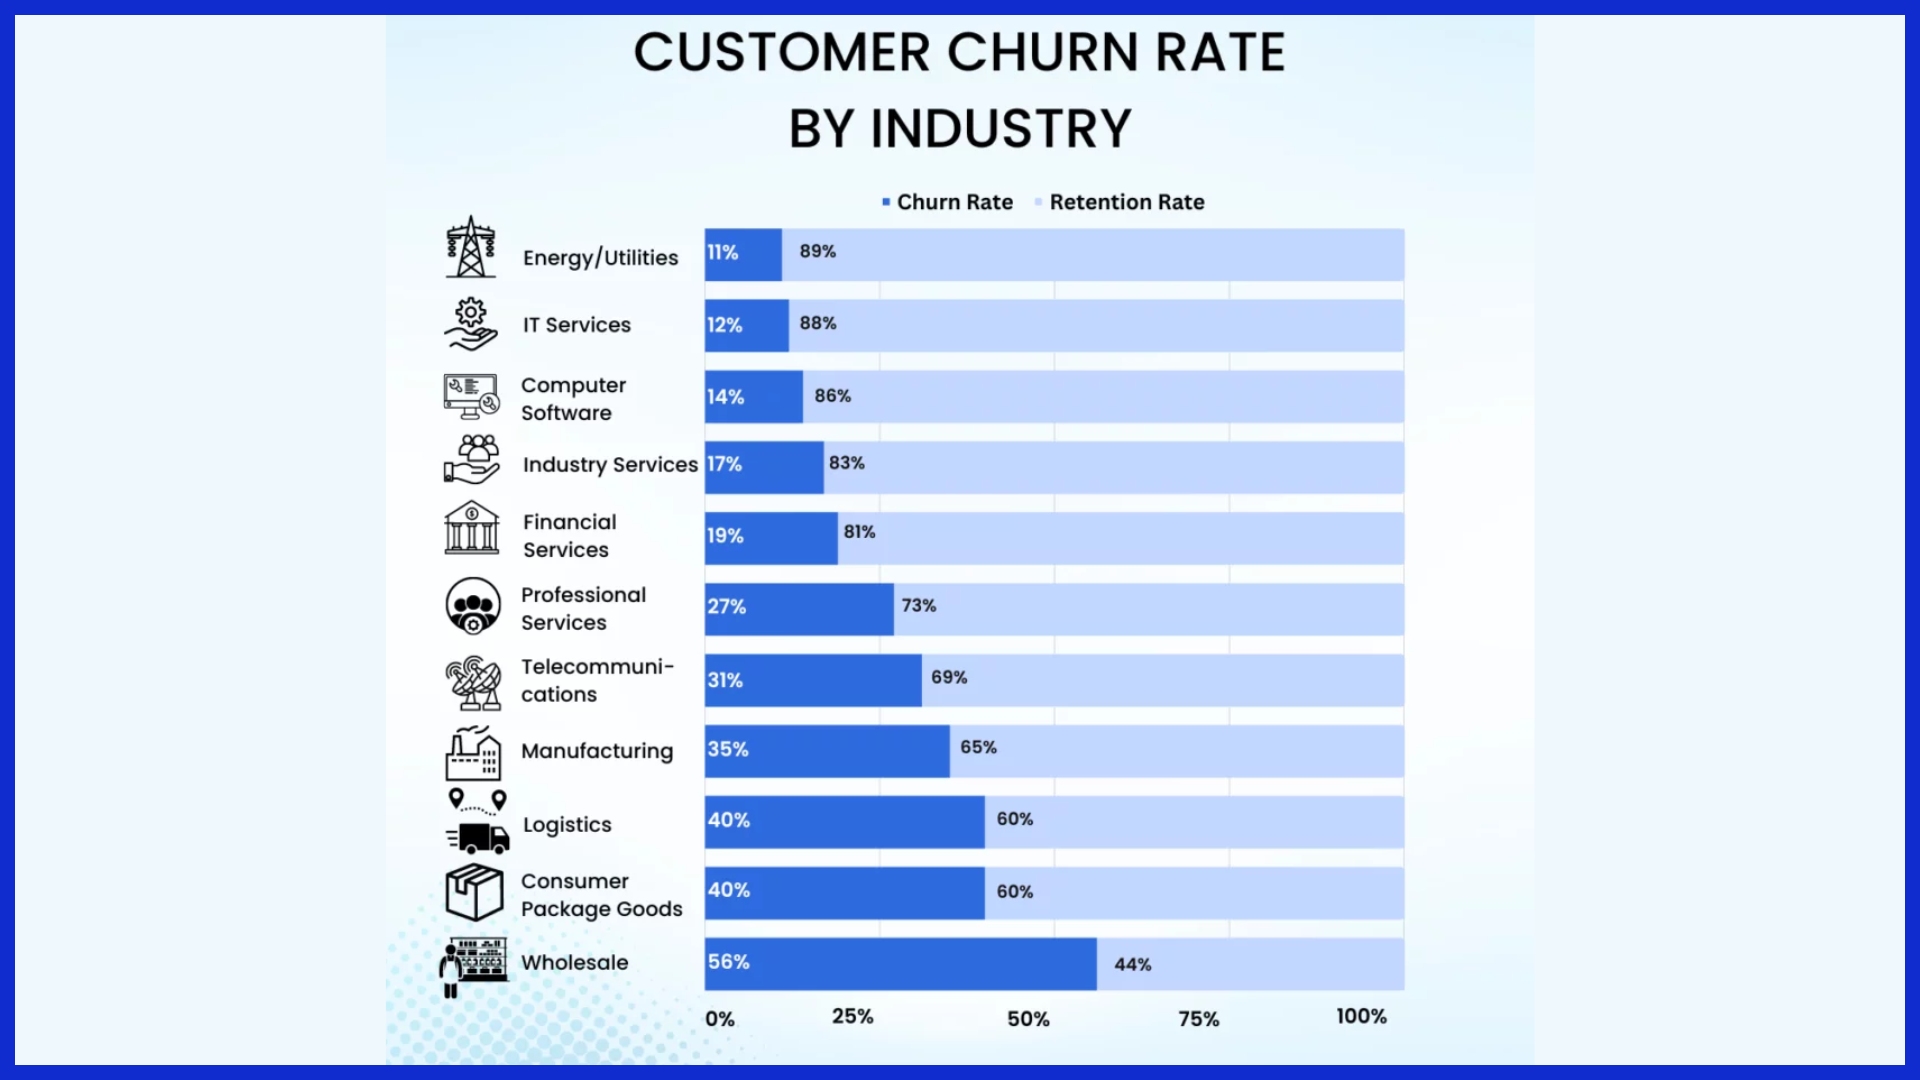
Churn rates vary wildly by industry. SaaS firms, for instance, may have lower churn than e-commerce or retail. You might have heard that annual SaaS churn below 7% is excellent and enterprise SaaS products benchmark for less than 1% monthly churn.
E-commerce and retail can be much higher. Annual churn in retail is between 20% and 37%, mostly because of price sensitivity, lower loyalty, and many alternatives for consumers.
Subscription services sense these transitions. Subscription box companies tend to experience more churn than a streaming platform, for example, as the perceived value and customer journey differ.
In financial services, annual churn can reach 15 to 25 percent, with banks typically absorbing the brunt. The churn rate in each field shapes how firms approach retention, from loyalty programs in retail to onboarding in SaaS.
2. By Business Model
B2B tends to have lower churn than B2C. B2B contracts endure longer, and switching costs are more significant. Subscription models, which are common in SaaS, anticipate monthly churn to be in the range of 1% to 5%.

A 5% monthly churn is normal and not always a growth stopper. One-offs may not track churn quite the same, but repeat purchase rates are important.
Pricing counts as well. Premiumized products can help cut churn since buyers are more invested. Service-based firms tend to build more touch points, holding churn in check with continued engagement.
3. By Company Stage
Startups often experience churn rates of 10 to 15 percent in their first year. This is normal as they read what users desire and adjust their proposition. Growth introduces new churn challenges, so onboarding or feature-add strategies aid retention.
Mature companies attempt to hold churn to less than 7 percent annually, often with loyalty or referral programs. When a firm begins to scale, churn reduction must follow suit. What worked at 100 customers is not necessarily going to fit when you have 10,000.
4. By Customer Segment
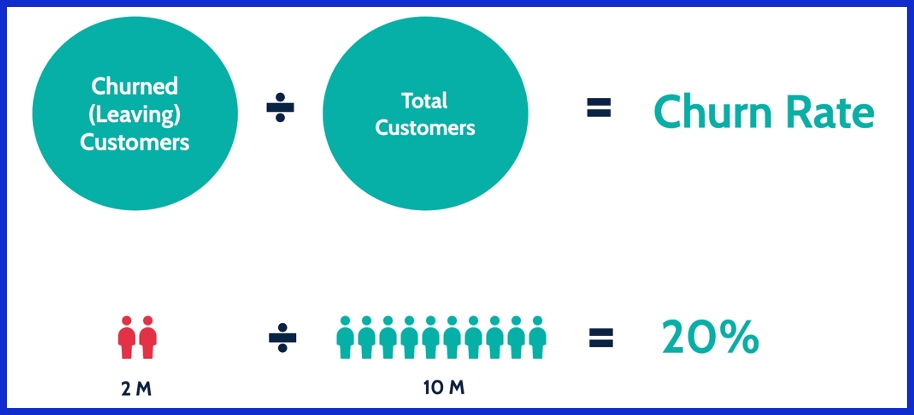
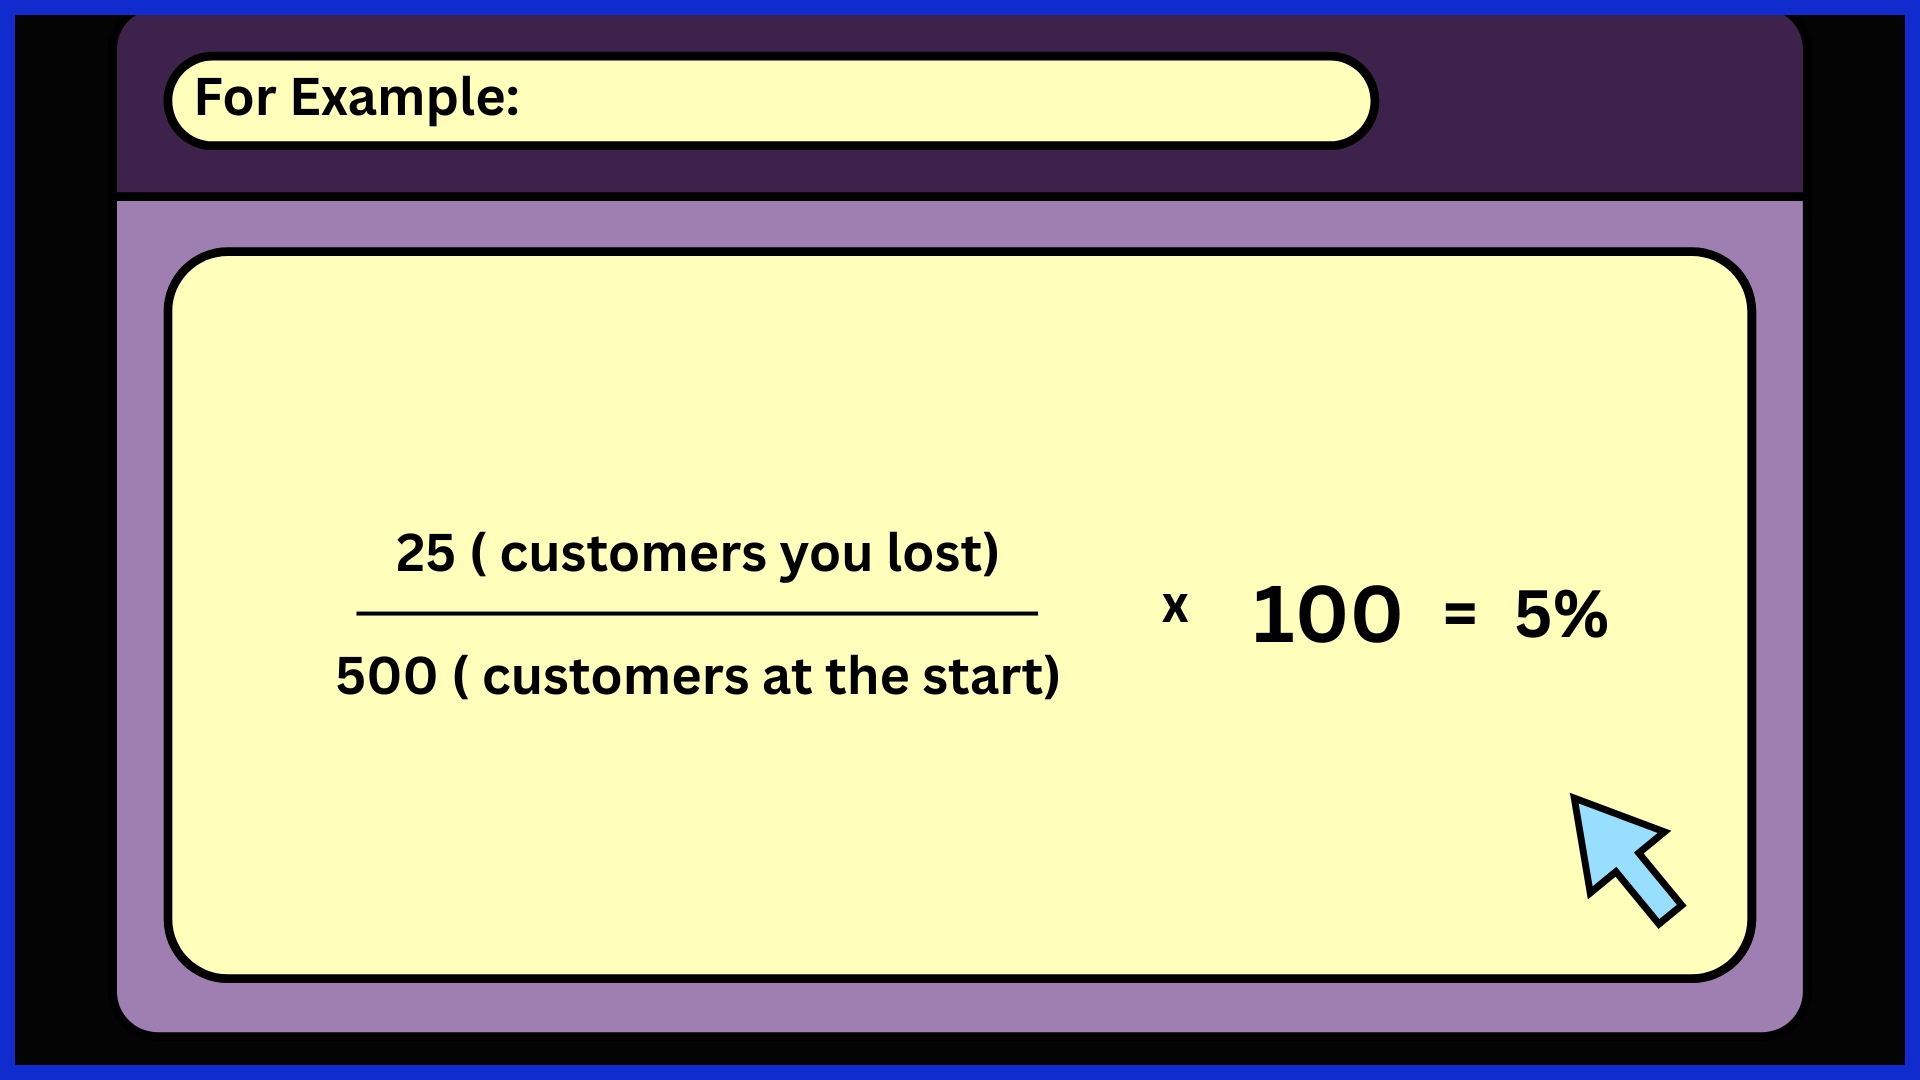
To find churn, use this formula:
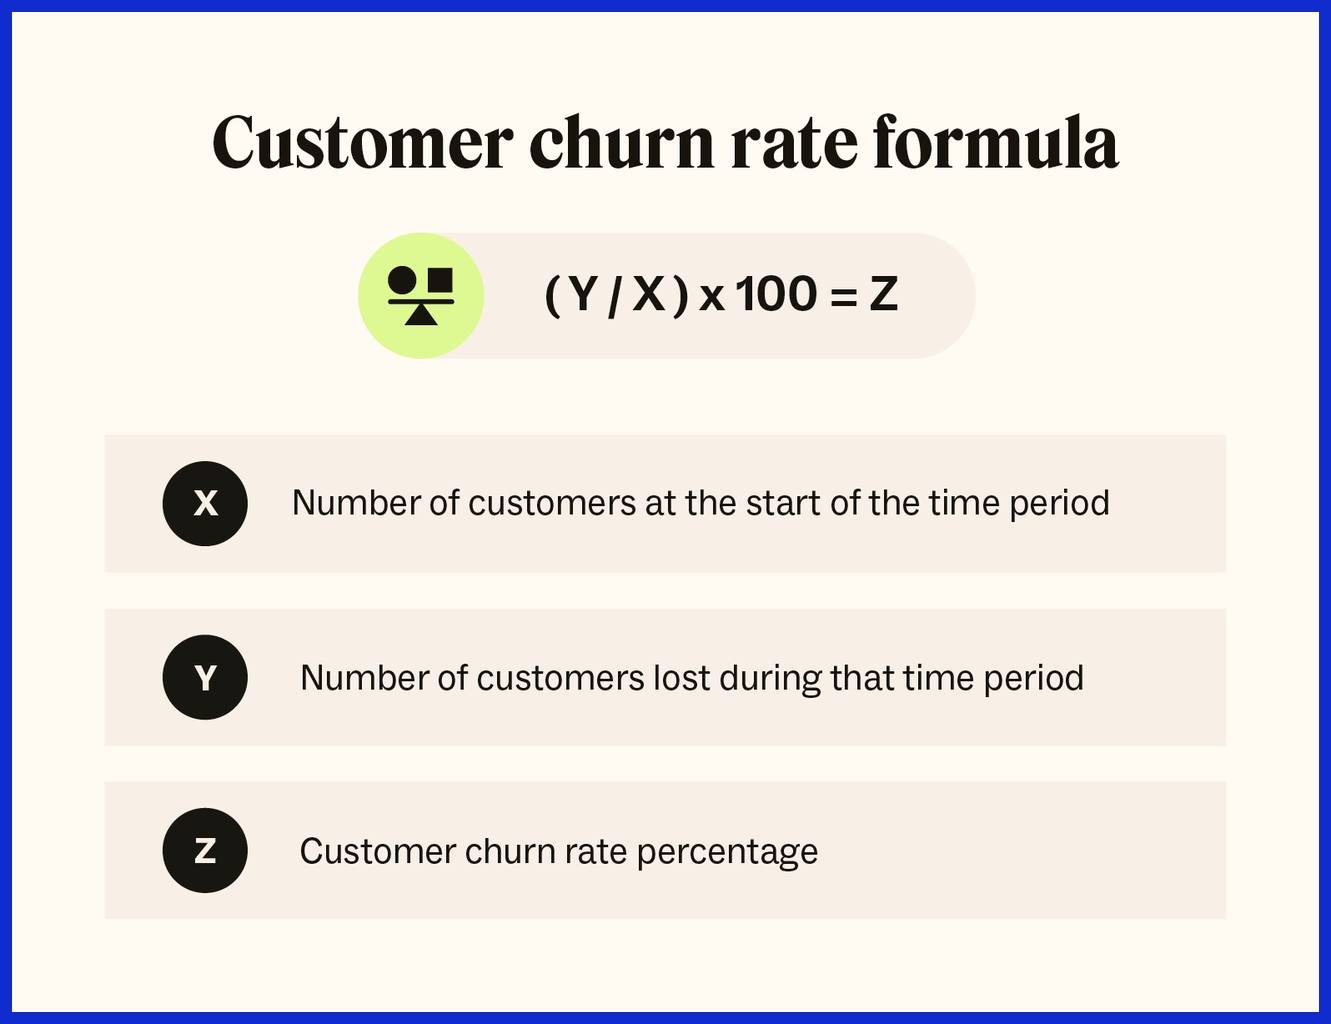
Customers lost divided by customers at start multiplied by 100.
For instance, if you begin with 500 users and lose 25, your churn rate is 25 divided by 500 multiplied by 100, which equals 5 percent.
For monthly churn, do this every month. For annual churn, add the monthly rates or calculate over the course of a year. Monitoring churn assists in identifying patterns and strategizing future actions.
A table like this, showing churn over time split by customer type or cohort, makes it easier to see patterns and act fast.
How to Calculate Churn

Customer churn is the portion of customers who cease using a business’s product or service over a specific timeframe. Churn rate indicates revenue loss and can be a red flag for problems with customer satisfaction, product fit, or market competition. Tracking churn is critical for business health because even a minor uptick in churn can stall growth or cut into profitability.
Businesses must dissect churn information and identify what’s going on by market segment, geographic area, subscription tier, or any other characteristics. Placing churn alongside customer acquisition figures provides a more complete picture, indicating whether new sign-ups are offsetting attrition.
Customer Churn
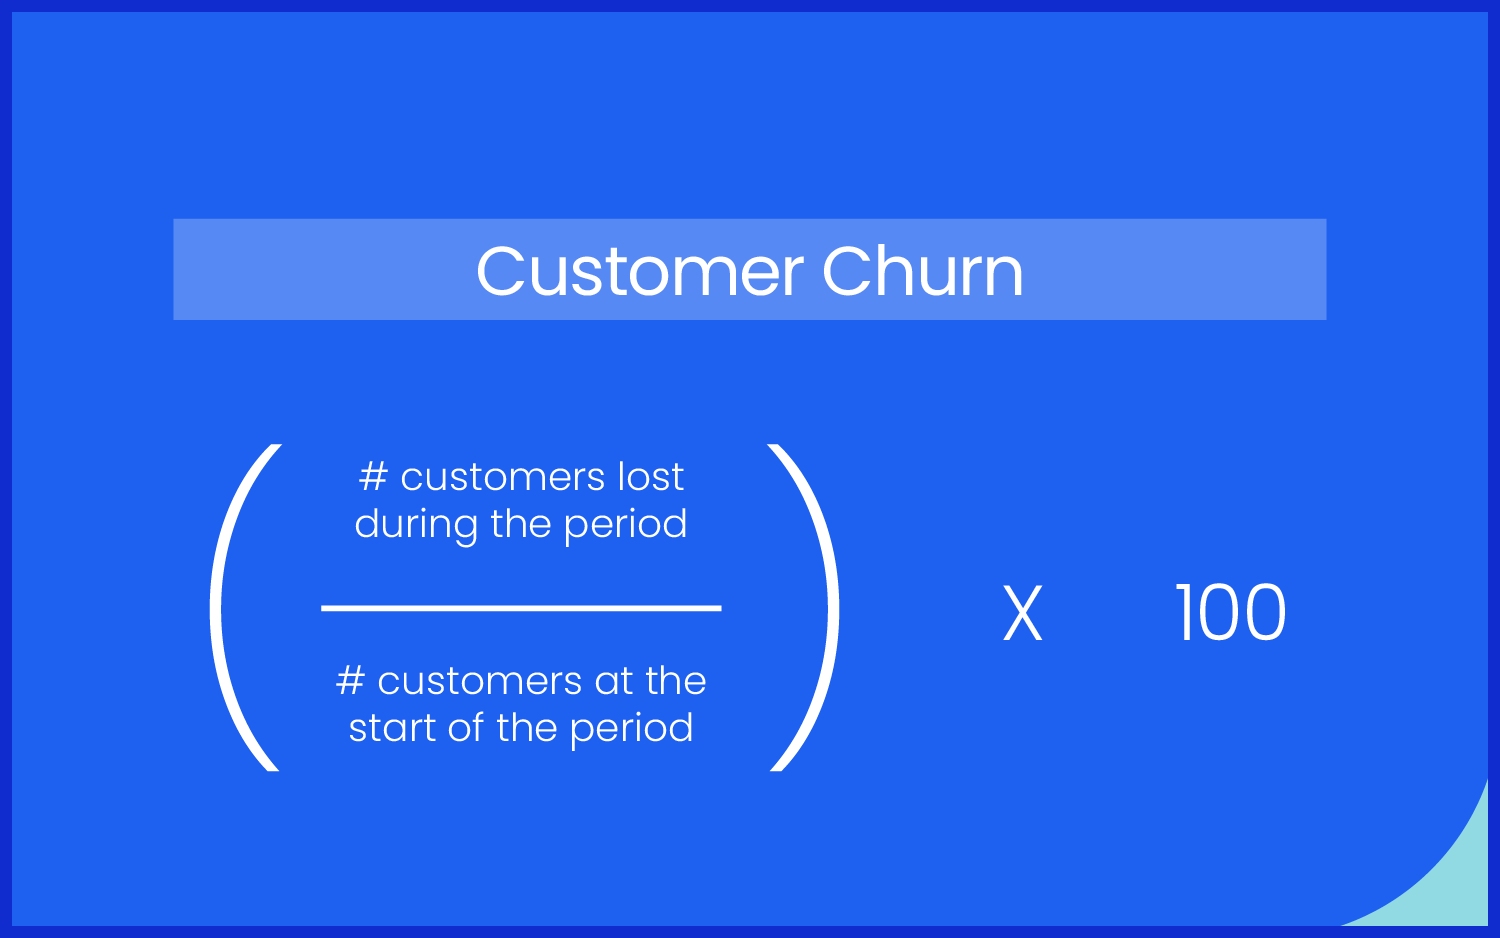
Customer churn is centered on the number of lost accounts or users, while revenue churn rate measures the financial impact of those who leave or downgrade. These two metrics aren’t necessarily the same; for instance, losing one large client can significantly affect revenue more than the loss of several small customers. Understanding the customer churn rates is crucial for businesses aiming to improve their overall performance.
To find customer churn, use the formula: Churn Rate percent equals Churned Customers divided by Beginning Customers multiplied by 100.
Ensure that you use the same time period each time—monthly, quarterly, or yearly—for clear trend lines. Churned subscribers are straightforward to calculate; simply subtract your ending number from your starting number. To determine the average monthly churn over a year, add up each month’s churn rate and divide by 12 for accurate churn rate calculations.
Customer lifetime, or how long a user sticks around, is determined with Customer Lifetime equals 1 divided by Churn Rate (percent). Monitoring both customer and revenue churn provides a clearer, more actionable view of business health.
Revenue Churn

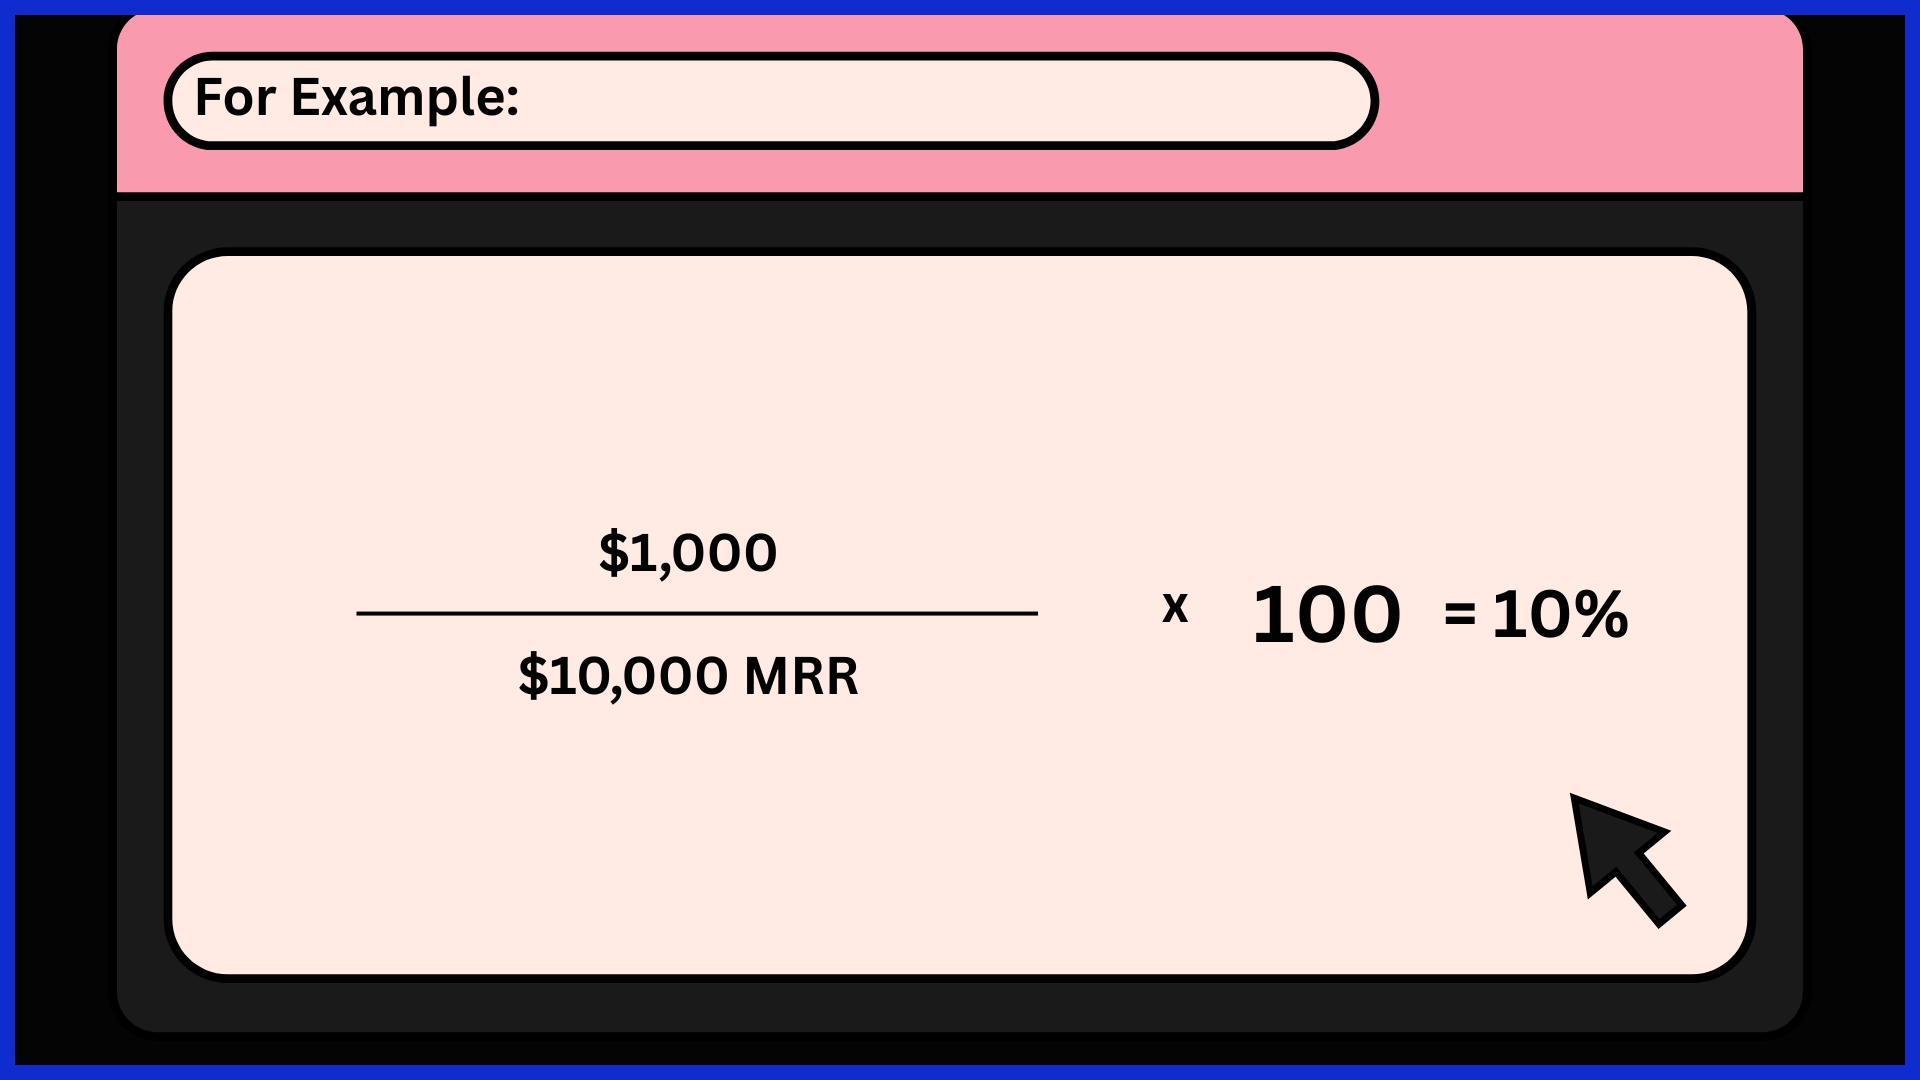
Revenue churn captures lost revenue due to downgrades or cancellations. Divide the revenue lost from these actions by the starting revenue to calculate this number.
For instance, if you have $10,000 MRR and lose $1,000 to churn, your revenue churn rate is $1,000 divided by $10,000 multiplied by 100 equals 10%.
This knowledge assists in projecting revenue and budgeting, particularly in SaaS or subscription environments. Both customer and revenue churn have to be monitored carefully because high-value customers can make a bigger impact than just losing people.
Common Pitfalls
Failing to include new customer sign-ups in churn math can provide a false impression of loss or growth. If you don’t take into account seasonality, such as more cancellations in some months than others, churn spikes can look alarming. Taking just the average churn rate conceals variation among customer cohorts.
What Drives Customers Away?
Churn occurs when customers no longer trust, feel abandoned, or simply no longer see value. It usually relates to how companies treat customer experience, service, support, and engagement. Across industries, research demonstrates that poor service and weak relationships contribute significantly to high churn rates. Understanding these drivers can help teams solve pain points early and maintain a healthy retention rate.
Service Gaps
If a product or service isn’t meeting needs, the value goes down. Unheard, unsupported customers seek alternatives. For instance, a business software user who cannot get immediate assistance with a technical problem will soon lose patience and drop the subscription. Matching your product offer with what customers expect is essential.
Teams need to check frequently if their value proposition still aligns with reality. Implementing quick surveys that question customers on their experience and satisfaction assists in identifying where your service is lacking, thus enabling you to close gaps before they get larger.
Value Mismatch
A bad onboarding experience is among the leading causes of early churn. If new users get lost or confused, they might never see the value of the product. Helping customers during those first days or weeks with easy-to-follow tutorials or simple check-ins can make all the difference.

Among companies that track onboarding success, for instance, the percentage of users who complete a first task, they can identify where people drop off and repair those steps. Making onboarding better does more than reduce churn; it creates a tone for the entire customer journey.
How to Reduce Churn

To reduce customer churn rates, it’s essential that your customers feel appreciated, heard, and cared for, as this fosters customer loyalty. Periodic outreach, customization, and quick action on concerns all contribute to a higher retention rate. Utilizing CRM tools to track engagement allows businesses to spot potential churn early, while cost-effective reporting solutions help make sense of the data.
Proactive Engagement
Staying ahead begins with market- and customer-matched pricing, which is essential for reducing customer churn rates. When pricing is right and reflects the value, customers are less likely to experience voluntary churn. Regularly reviewing and making small tweaks to pricing helps keep it competitive and aligned with customer expectations.
Experimenting with different pricing models, such as annual contracts or discounts for long-term plans, provides customers with incentives to remain loyal, offering them savings and predictability for their budgets. Implementing value-based pricing can strengthen customer relationships and show that you understand their priorities.
Strategic Pricing
Customer feedback is the easiest way to identify what drives churn. Companies that request feedback via polls, suggestion boxes, or personal outreach listen to what’s most important. Taking action on feedback both refines the offering and demonstrates to customers that their voices are being heard.
Taking easy feedback paths, such as in-app questions or scheduled check-ins, builds trust and helps companies adapt before minor issues escalate. CRM is a great way to collect and organize this feedback, so it’s easier to identify patterns and respond.
Better Onboarding
Churn rate is only one piece of the puzzle. Examining customer lifetime value, engagement scores, and satisfaction ratings provides a more nuanced indication of customer well-being. Monitoring indicators such as a decrease in logins or tardy payments assists in identifying potentially lost customers prior to their exit.
When combined with financial and support data, these metrics provide a complete picture, enabling companies to take quick action and better combat churn.
Beyond the Churn Rate Metric
Churn is only one piece of the puzzle. To understand what’s a good churn rate, it can be helpful to observe other important figures, such as customer lifetime value and net revenue retention, which provide deeper insights into business health and long-term growth. Understanding these metrics enables teams to identify blind spots and optimize their customer retention rates for maximum effectiveness.
Customer Lifetime Value

CLV is the total amount of money a customer is expected to spend with your business over their entire relationship.It’s important because it helps you decide how much you can afford to spend on getting and keeping customers.
In the SaaS industry, an annual churn rate of 5 to 7 percent is considered a solid benchmark for mature companies, while a monthly churn rate of 5 to 10 percent is typical for startups. These churn rate calculations directly impact CLV; a lower churn rate correlates with a higher lifetime value. To succeed, companies must continually explore strategies to increase CLV, such as launching effective loyalty programs and enhancing customer service.
Customer Health Score
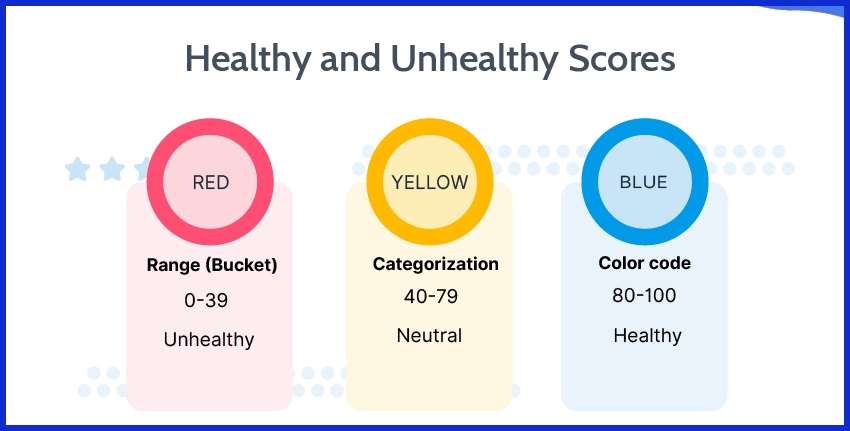
A customer health score helps predict which customers are at risk of leaving. It’s built using data like product usage, support tickets, payment history, and customer feedback.
When a once-active customer suddenly stops engaging, that’s a red flag — and a chance to step in before they churn.
Using predictive analytics can help firms identify patterns that humans might overlook. By acting on health score insights — sending check-in emails and offering training — you can significantly enhance customer retention rates. This approach is particularly helpful for higher-churn industries like IT services, where the average churn rates often lie in the 10 to 15 percent range.
Net Revenue Retention
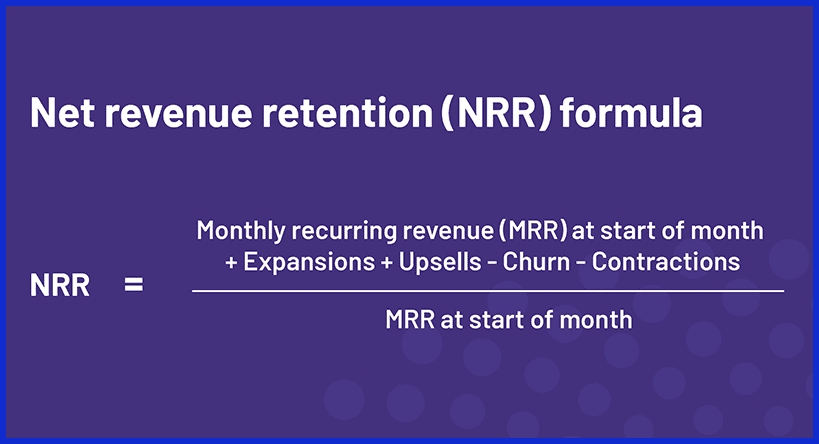
NRR measures how much recurring revenue you keep from existing customers — including upgrades, downgrades, and cancellations.
If your NRR is above 100%, that’s a great sign. It means customers are not only staying but also spending more.
Churn Metrics in Business Strategy
Churn rates vary by industry, contract type, and business model. Manufacturing and professional services tend to have an annual churn of less than 15%, while SaaS and IT providers may encounter higher levels. It’s okay to set targets based on where you fit.
A company that manages churn effectively is a company that has more profit, more predictable revenue planning and less waste in marketing spend.
Conclusion
Churn rate is a reality check. It informs you who stays, who goes and what drives them off. Low-churn brands don’t just get lucky. They listen, they adjust the weak points, they inject genuine attention at every stage. A solid churn rate usually means people find it useful and stick around. Companies that watch churn identify issues early and respond quickly. Churn reduction enables teams to retain happier people, invest less to regain lost ground, and develop credibility.
To improve, keep track of key metrics, listen to feedback, and take action on insights. With KPI.me, you can simplify that process. KPI.me’s AI-powered dashboard generator turns your business data into clear, real-time visual insights — helping you monitor churn, track retention KPIs, and see exactly where improvements can be made.
Frequently Asked Questions
What is a good churn rate for most businesses?
A good churn rate, ideally under 5% per month, is crucial for subscription businesses; however, your best rate depends on your specific industry services and market dynamics.
How do you calculate churn rate?
Lost customers divided by the total customers at the beginning of the period multiplied by 100 gives a percentage, which is essential for churn rate calculations.
Why does churn rate matter so much?
Churn rate analysis indicates your customer retention rates; high churn drives up costs and stunts growth, while monitoring it boosts retention and revenues.
What factors cause high churn rates?
Bad support, unfulfilled promises, and expensive pricing contribute to high churn rates, while understanding these factors helps improve customer experience and retention.
Can reducing churn increase profits?
Yes, it’s cheaper to keep customers than to incur customer acquisition costs for new ones. Beyond that, lower customer churn rates drive more consistent revenue and greater profits over time.
Is churn rate the only metric to watch?
Churn matters, but follow CSAT, LTV, and retention rate for the complete story.
How often should you check your churn rate?
Review monthly customer churn rates to identify trends in their incipiency, enabling rapid response to shifts in customer behavior.