Executive Dashboard Examples You Can Use to Drive Results
Key Takeaways
- Executive dashboards provide an at-a-glance, up-to-the-minute visual overview of key indicators so leaders can see the big picture and make smarter decisions faster.
- Dashboards that deliver results hit the sweet spot of beautiful design and digestible content, while avoiding information overload by sticking to relevant KPIs and actionable insights.
- By customizing dashboards for each type of executive, you can focus on the data most relevant, be it for a CEO, CFO, CMO, COO, or CIO/CTO.
- Unlike typical reports, dashboards—when designed thoughtfully—synthesize data and find relevant context, highlight trends in performance over time, and offer early warning indicators.
- Creating dashboards that make a difference takes an understanding of user-focused design, bringing together different data sources, and continuous feedback from those executive users.
- Looking ahead, we can expect to see executive dashboards leverage AI-driven predictive analytics, become increasingly more personalized, and be more mobile-first to accommodate today’s dynamic business landscape.
Executive dashboards are designed to communicate complex, real-time business data in easy-to-understand, visual layouts tailored to business leaders.
In the United States, these dashboards typically have the main sales figures, expenditures, and status of projects.
With easy-to-understand charts and graphs, leaders can identify potential trends or issues in a matter of seconds.
Most teams have adopted the use of dashboards to keep meetings brief and distribute status reports.
This post features some actual dashboard examples, illustrating how dashboards can assist decision makers in maximizing time and keeping projects on track.
What Is An Executive Dashboard?
An executive dashboard is a visual, centralized tool that aggregates the most important business metrics in one place. It’s designed to provide executives a quick, easy-to-understand overview of their organization’s performance using real-time information. The dashboard aggregates data from multiple sources.
This allows you to see trends and relationships that raw reports or spreadsheets can’t show. Shining a light on performance, leaders find one place to view trends in time, monitor metrics that matter most, and identify what’s successful and what needs improvement.
Executive dashboards aren’t one-size-fits-all—each leadership team has distinct goals, so every dashboard should be tailored to reflect their specific priorities and decision-making needs.
For instance, the sales department may care most about revenue and pipeline. At the same time, operations might focus on efficiency or supply chain metrics. A well-made executive dashboard keeps relevant info easy to find so busy leaders can look at their numbers and make a call fast.
Unlike the raw data dumps, these executive dashboards allow for leadership to identify trends and make actionable predictions on what’s likely to occur moving forward. There are several types: strategic dashboards track big-picture goals, operational dashboards show what’s happening day-to-day, and analytical dashboards dig into data for deeper insights.
Dashboards can be configured for different users or teams. They have functionality such as alerts when a number reaches a specific level and drill-downs to see the underlying data!
More Than Just Pretty Charts
Executive dashboards aren’t just overproduced scorecards. They provide clear, concise guidance—not just data dumps. A well-designed smart dashboard marries interesting aesthetics to useful intent.
That way, leaders don’t just look at data—they know what actions you need to take next. For instance, a dashboard might visually represent which products are failing to meet sales goals or identify when customer churn is increasing through alerts or color-coding.
Driving Decisions, Not Data Dumps
An executive dashboard’s role isn’t to dump information on execs, but rather to quickly display what’s important. By allowing you to focus on high-level KPIs that affect the business at a macro level, dashboards help eliminate the noise.
As an example, a CEO of a SaaS company may want churn rate, lifetime value, and new signups highlighted.
A Leader’s Strategic Compass
Dashboards allow executives to align their day-to-day decisions with broader organizational objectives. They identify emerging trends and flag areas of concern, allowing executives to intervene before issues escalate.
A drop in customer traffic appears instantaneously. You don’t need to wait a full month for it to show up in a quarterly report!
Executive Dashboard Examples In Action
With executive dashboards, leaders can get a real-time, at-a-glance view of what’s most important. Each of these roles has its own unique needs, which is why dashboards are most effective when created specifically for a role. They centralize data from all over the enterprise—finance, operations, marketing, tech—into a single, easy-to-use platform.
This provides a clearer, more concise, and visually appealing way to identify trends, monitor progress towards goals, and respond quickly.
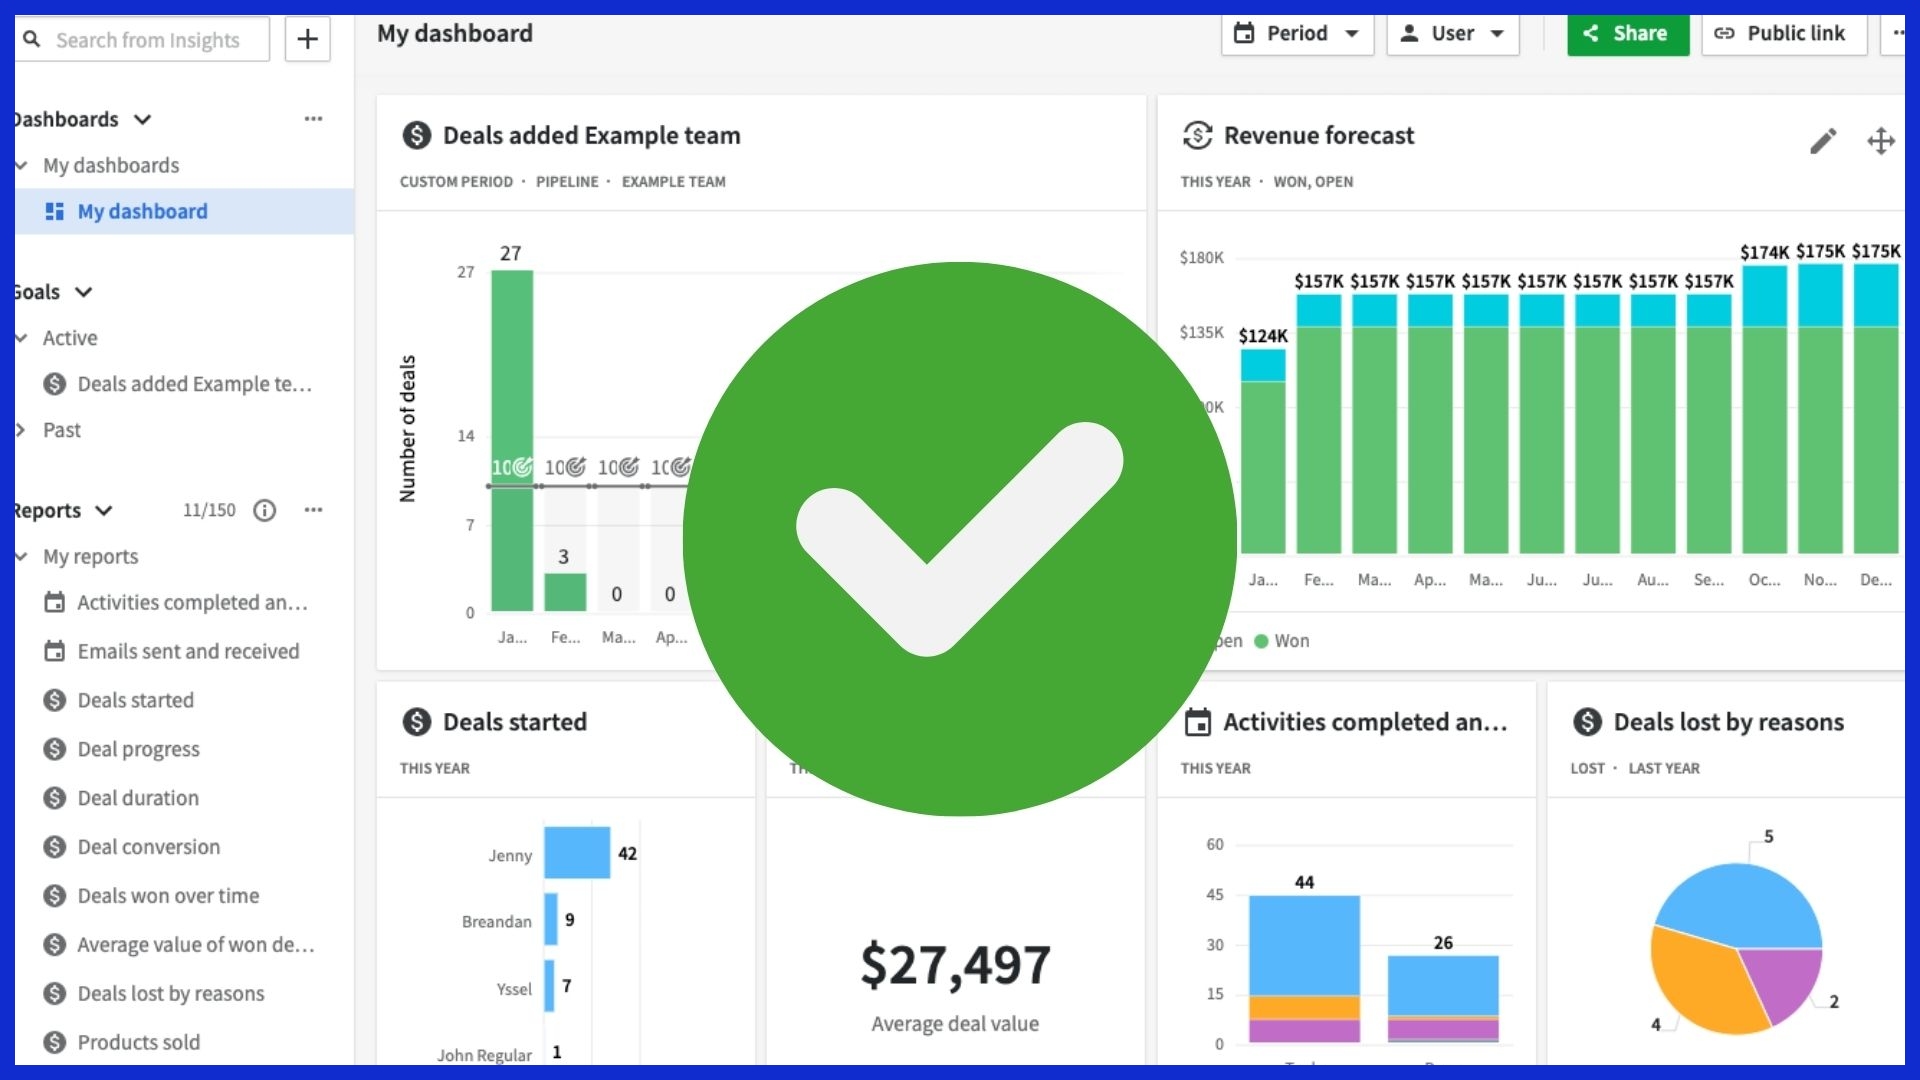
1. CEO Dashboard
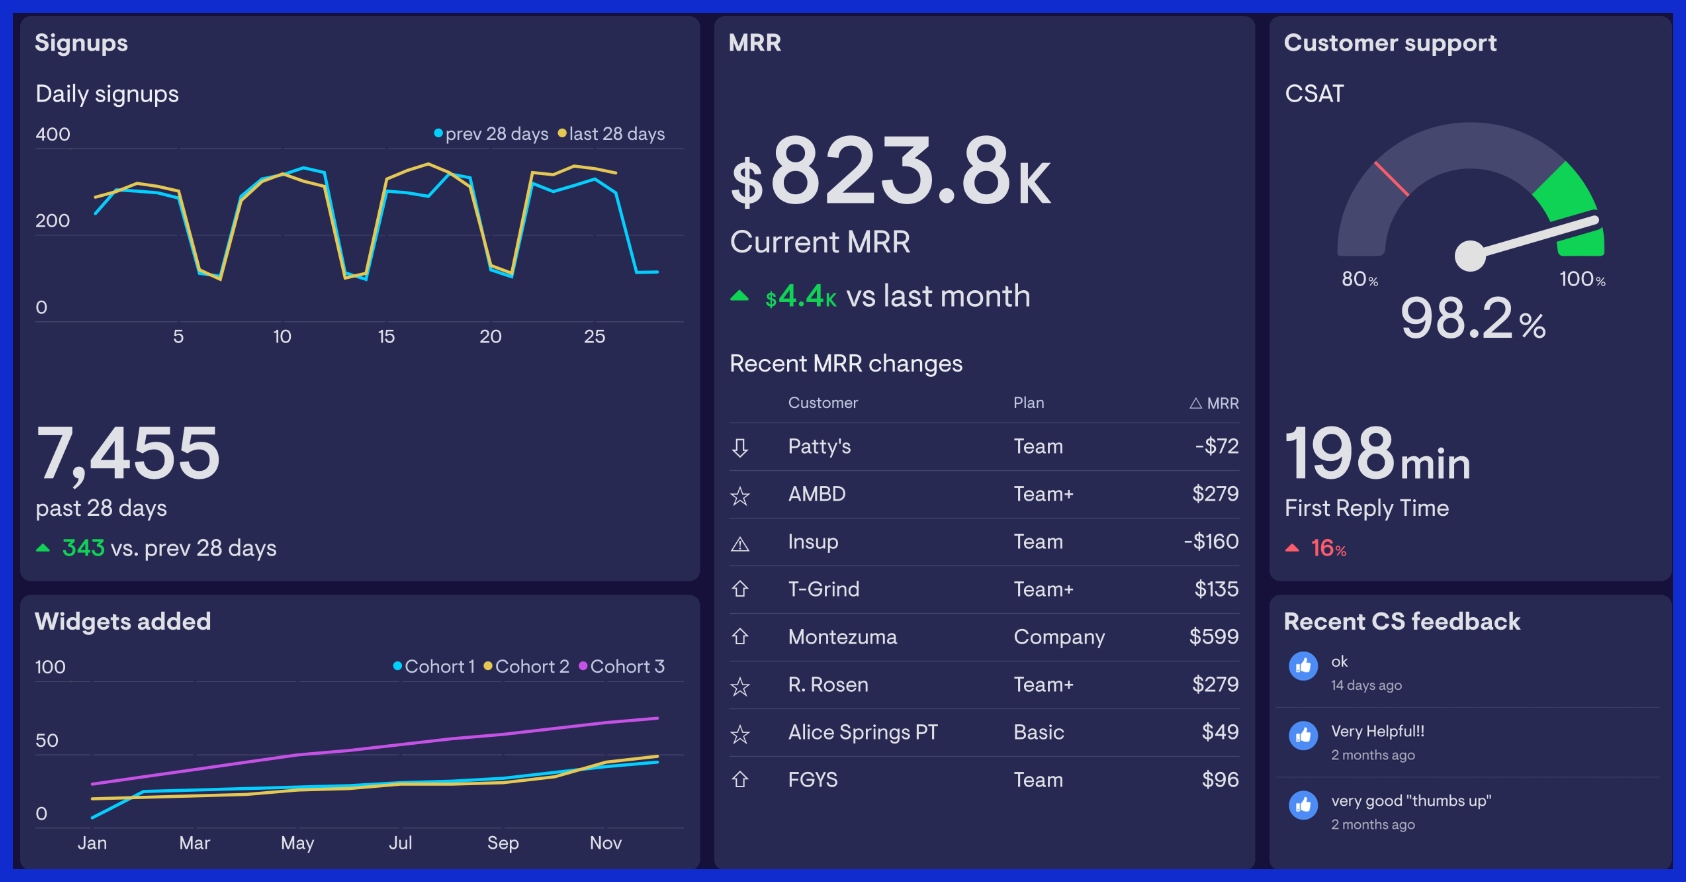
A CEO dashboard provides a comprehensive view of financial, operational, and market data. Key metrics such as revenue, profit, new customers, and market share lie front and center. These dashboards allow CEOs to maintain a holistic business view, identify risks sooner, and establish executive-level priorities.
By integrating data from sales, support, and production, it provides the most holistic snapshot, allowing for effective short-term health checks and long-term strategy planning.
2. CFO Dashboard
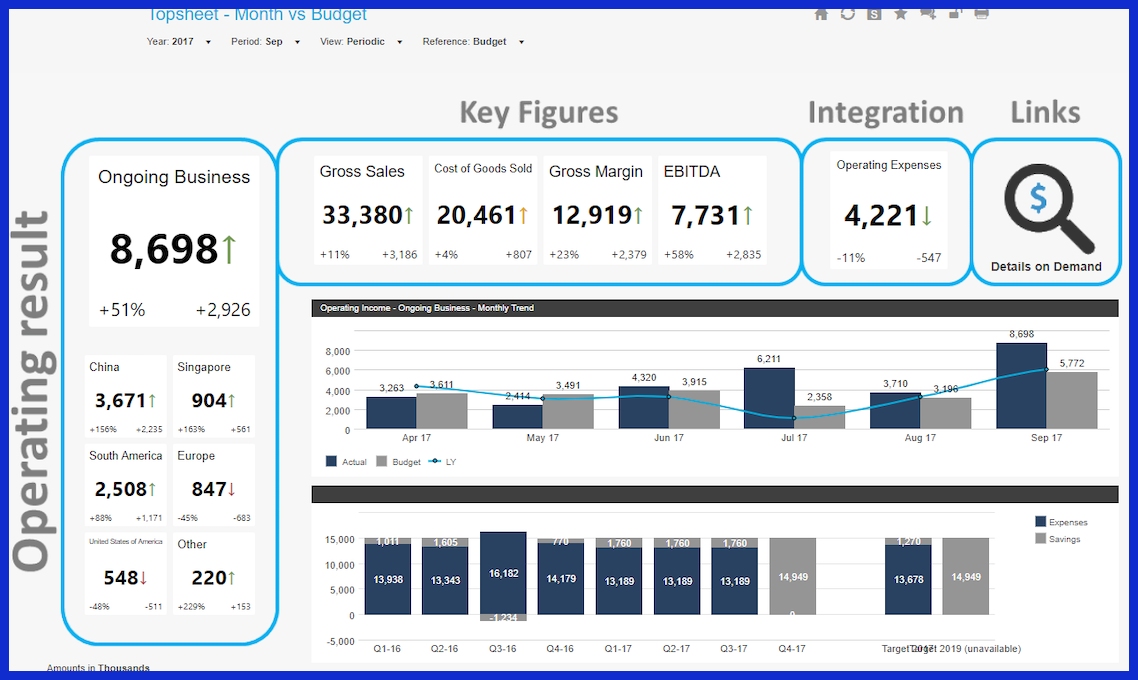
CFO dashboards monitor cash flow, profit margins, and expense ratios and ensure that forecasts are accurate. Always up to date, it can help answer questions such as whether spending is on track with budgets or whether revenue is meeting projections.
These dashboards are valuable tools for identifying cash deficits, aiding in audits, and directing investment priorities. They’re usually updated at least daily, if not weekly, to maintain an up-to-date picture.
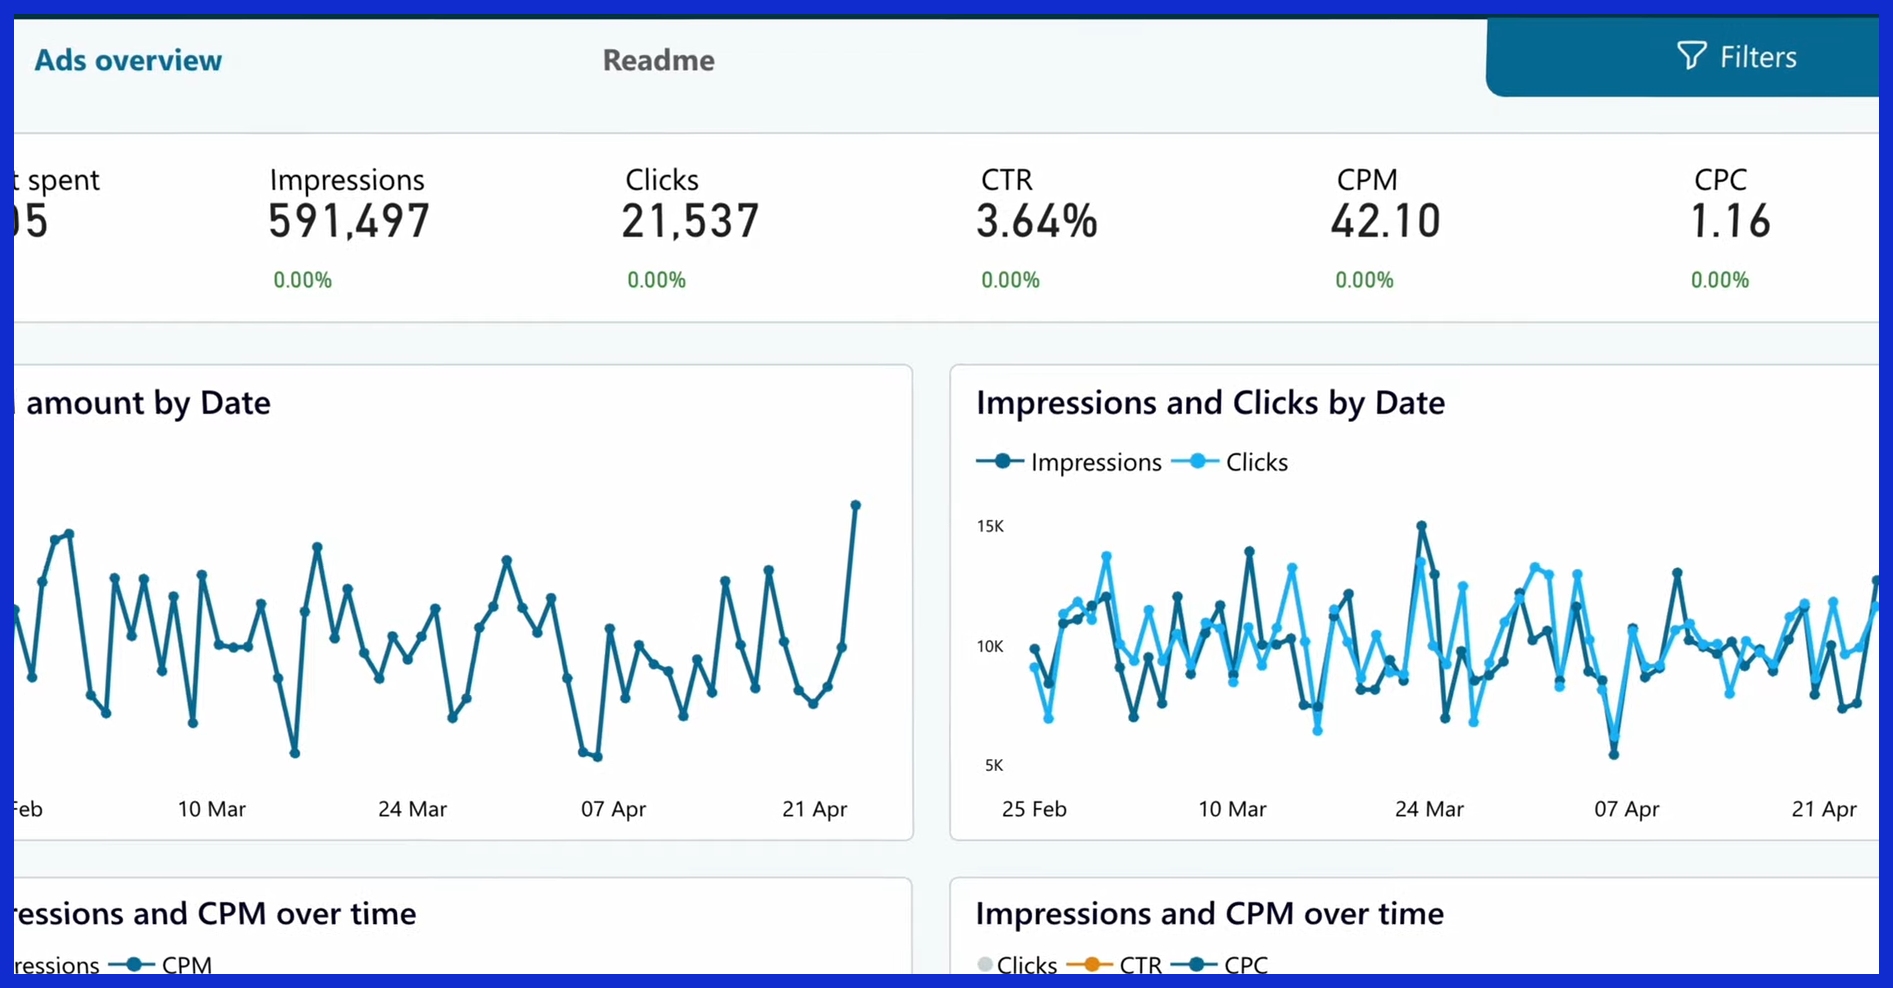
3. CMO Dashboard
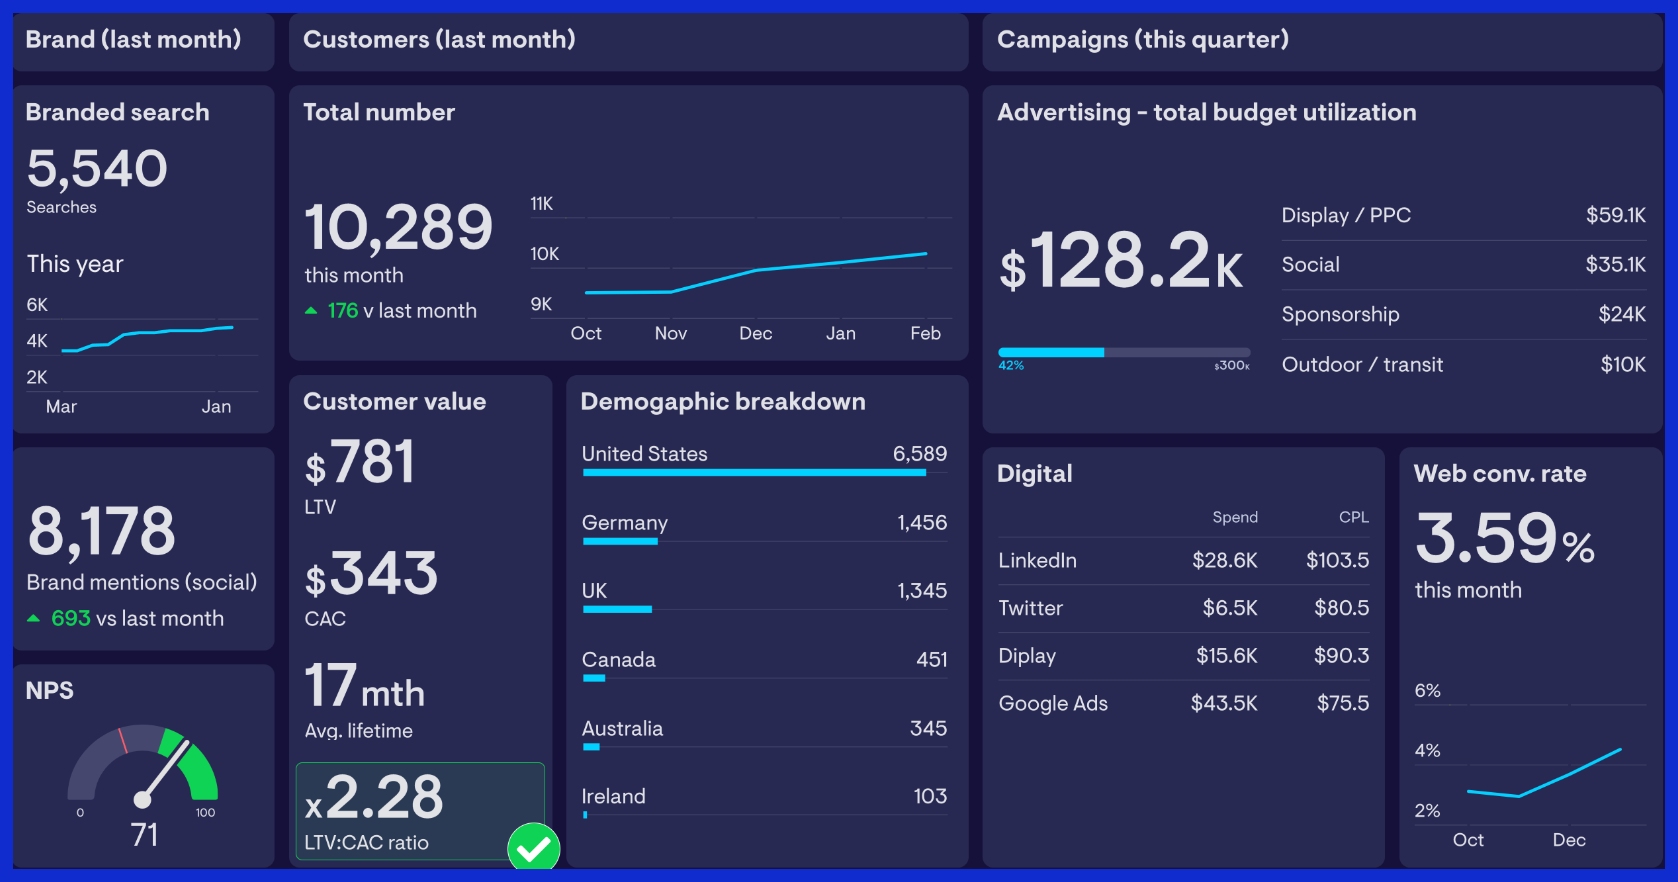
CMO dashboards monitor KPIs such as campaign return on investment, lead quality, website traffic, and conversions. These insights show you what’s most effective across all channels and at what point customers abandon.
By keeping a watchful eye on engagement rates and cost per lead, CMOs are able to reallocate budgets and adjust campaigns as necessary to achieve optimal results.
4. COO Dashboard
COO dashboards track production rates, order cycle times, back order rates, and other supply chain bottlenecks. Just as crucially, they help COOs flag bottlenecks and address slowdowns quickly.
Monitoring labor costs, downtime, and defect rates increases velocity and quality for all teams.
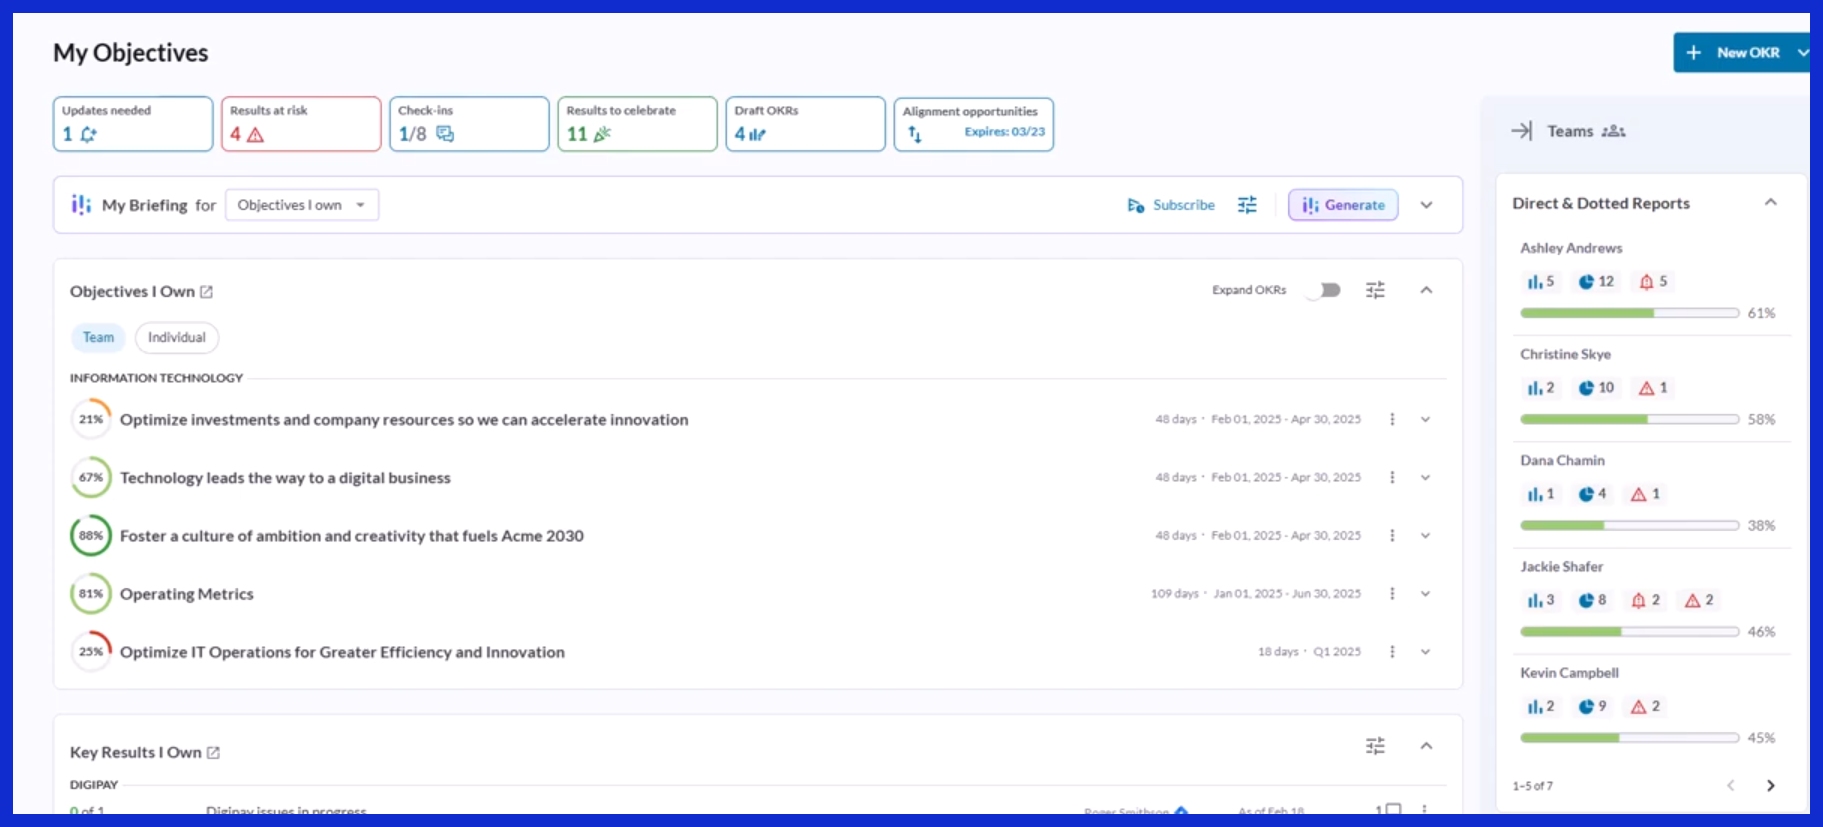
5. CIO/CTO Dashboard

CIO and CTO dashboards monitor system uptime, project milestones, and return on technology investments. Providing real-time alerts on outages or project timelines allows technology leads to take action before problems escalate.
Monitoring adoption rates and innovation spend directs future tech investments.
Why Standard Reports Often Miss

The truth is, standard reports are ubiquitous across businesses. They miss the mark when leaders need true actionable insight, and need it quickly. These reports tend to squeeze too many KPIs onto one report. This information overload can obscure what’s important. When a dashboard tries to stuff 50 different metrics down our throats, it’s not an action guide, it’s an information overload recipe.
Too often, reports combine disparate data in a way that no one can truly derive value.
Lacking True Management Insight
Most release the surface. They lack the bite required for high-level, strategic decision-making. The data can tell you what the numbers are, but it can rarely tell you what’s driving those numbers. Executives require more than a single, top-level metric.
They need to understand what caused a decrease in new leads or an increase in churn. Because without a story to connect the dots, those numbers are just noise. That’s where a custom executive dashboard comes in—transforming raw data into meaningful insights, such as connecting campaign spend to increases in qualified pipeline and more.
Missing Critical Early Warnings
We know how quickly business turns. Standard reports miss the mark because they are strictly retrospective. Missing Critical Early Warnings can lead to failing to foresee trouble, such as a decline in customer health indicators to a deceleration in sales cycles.
Good dashboards catch these trends in advance. Predictive analytics can flag risks—say, a sudden fall in high-value account activity—so leaders can act before problems grow.
Data Without Meaningful Context

Just throwing numbers at people doesn’t work. Without a meaningful context, data can lead readers to misinterpret the state of play. An increase in website traffic, for instance, is irrelevant if it can’t be connected to actual conversions.
Adding comments or basic definitions directly next to the data points increases understanding across teams about what is important.
Overlooking Key Strategic Links
Standard reports usually fail to capture how each metric interacts with the others. They tend to overlook the links between sales, marketing, and customer success.
With custom dashboards, you can better track how one strategic change, such as more targeted email lists, increases both engagement and revenue. This ensures that teams are aligned around the activities that will produce winning results.
Crafting Effective Executive Dashboards
An executive dashboard isn’t simply a display of numbers; it serves as a robust dashboard that empowers leaders to identify important metrics and make strategic decisions.
Understand Your Audience
The first step, as with any dashboard, is to understand who will be using the dashboard. No two dashboards are alike; every dashboard needs to be tailored to its intended audience and goal. Some are high-level, focusing more on strategy, while some are more tactical, focusing on daily operations, analytics, or even specialty functions like sales or finance.
The end goal stays the same: give a clear, quick look at performance so leaders can act fast and smart.
Essential Elements for Real Impact
No dashboard should display more than what is required for quick decision-making. This means clear, simple visuals—think line charts to track growth, bar charts to show comparisons, or color coding for quick status checks.
The most effective dashboards limit information to what’s most relevant, keeping it digestible and visually appealing and steering clear of clutter and data overload. They further establish context, often with benchmarks or targets to demonstrate what is considered good or bad.
Prioritize Your Key Performance Indicators
Identify the handful of KPIs that best align with your business objectives. Having too many metrics dilutes the focus from what truly matters.
A short list of primary KPIs helps ensure your dashboard remains focused and actionable. For instance, a SaaS dashboard would center around MRR, churn, and CLV.
Master Visuals for Clarity
Your charts and graphs need to tell the story at a glance. Overdeveloped visuals aren’t worth it—leaders want the bottom line.
Go for minimalistic designs and simple color palettes so that trends can easily stand out.
Harness Real-Time Data Power
With automatic real-time updates, leaders receive the latest information, empowering them to identify trends and changes and respond quickly.
This is essential for ops dashboards or agile markets.
Sidestep Common Design Traps
Avoid cluttered designs, color overload, and excessive legends. Regularly test dashboards with real users and solicit feedback to improve the user experience.
Modify when necessary to maintain clarity and reader engagement.
Build Your Impactful Dashboard
Developing a dashboard that will truly serve as an effective executive dashboard should begin with an understanding of what those who use it will need. Executive dashboards truly shine when they guide users to discover what’s most important. They allow you to see patterns faster, and they let you take action based on actual data.
There’s no one-size-fits-all blueprint—every dashboard should be tailored to the team or leader it serves. From start to finish, transparent and collaborative work with stakeholders transforms dashboards into resources that are truly useful and impactful.
Understand Your Executive Audience
Understanding the habits, preferences, and needs of your executive users is critical. Some need to see high-level overviews, others need to see trends over time, and some need fast access to drill-down details.
Interviews and short surveys are an excellent method to collect these insights, as they allow you to easily guide your dashboard priorities. Your CMO might want to know the campaign ROI and the split across digital channels. A CEO is singularly focused on revenue growth and other strategic KPIs.
By aligning your dashboard to these needs, you ensure it remains user-friendly and digestible.
Integrate Diverse Data Sources Smartly
Pulling in data from other sources such as Google Analytics, Salesforce, or even Excel spreadsheets provides a more complete picture of performance.
Second, by using a central data platform like KPI.me, all your information is automatically synced and updated in real time. This configuration allows them to monitor progress in real time and report in an easily understood way.
Users now have one consistent location to track progress, detect shifts, and recognize where to focus efforts.
Update with User Feedback
Dashboards get so much better when users come back and tell us what works and what doesn’t. Feedback sessions, quick polls, or regular check-ins with your audience can help refine layouts, add crucial missing metrics, or cut out unnecessary information.
Regularly updating the dashboard with new developments will help keep it valuable, clear, and appropriate for quick decisions.
Future of Executive Dashboards
Executive dashboards, a vital component of modern executive dashboards, are one of the fastest-evolving technology areas, propelled by new technology and growing data demands. Today, more firms than ever are using strategy dashboards to manage information overload and to get a glimpse at up-to-the-minute figures. The trend is clear—dashboards must give a full view, help leaders move quickly, and tie daily work to top goals.
AI-Powered Predictive Insights

AI is rapidly becoming a key, disruptive force in making dashboards more intelligent. It can analyze historical data, identify emerging trends, and provide recommendations in advance of issues even appearing.
Take, for example, we’ll use SaaS or you could use FinTech, AI can find dips in sales or increasing costs. So leaders can take action before these trends damage their bottom line.
Secondly, AI eliminates a lot of busy work by triaging data and triggering alerts, so leaders can focus on what’s important. This allows them to be more efficient with their time and make more informed calls.
Hyper-Personalization for Leaders
We know a one-size-fits-all dashboard won’t work for all occupations or industries. Today, dashboards allow each executive to choose exactly what they want to see, how they want to see it, and when they want to receive updates.
Tools like KPI.me allow users to dashboard for whatever they want, whether it’s daily sales or customer complaints. With custom alerts and smart filters, it’s easy to identify potential risks or unexpected wins.
This not only makes dashboards more useful but also helps to keep leaders engaged.
Conclusion
Executive dashboards aggregate all your data into one place, so executives can easily see what’s most important without searching for the solution. As you’ll see in each example, these quick wins and smart tweaks keep teams moving fast and staying sharp.
No more sifting through stacks of reports or pursuing outdated figures. The proper dashboard allows you to look at the overall picture. It provides a way for people to easily explore the specifics with a few clicks.
In a world that’s powered by data, dashboards help break through the clutter and deliver actionable insights. If you’re finally ready to flush the confusion and get your agency to work smarter, not harder, start your free trial with KPI.me today. Create the right kind of dashboard for you and put your successes front and center.
Frequently Asked Questions
What is an executive dashboard?
An executive dashboard is a robust visual tool that displays key business metrics and important data in real time, enabling executives to quickly grasp the organization’s performance and make strategic decisions.
How do executive dashboards benefit Los Angeles businesses?
Executive dashboards benefit Los Angeles businesses by providing valuable insights into local market trends, identifying new business opportunities, and measuring performance metrics.
What are some common features in executive dashboards?
What are some other common features in executive dashboards, such as strategy dashboards and analytics dashboards? These features allow decision-makers to quickly zero in on what’s important metrics.
Why are standard reports less effective than dashboards?
Why are standard reports so much less effective than a management dashboard? Dashboards, such as strategic dashboards, display data in real-time and utilize data visualizations, making it easier to identify trends quickly and providing executives with a more efficient use of time.
Can executive dashboards be customized for different industries?
Can executive dashboards, such as operational dashboards, be customized for other industries? For instance, hospitals in Los Angeles utilize a management dashboard to manage patient flow, while retailers leverage a sales executive dashboard template for sales and inventory management.
What should I include when building an executive dashboard?
Align with your KPIs, overarching business goals, and available data sources, especially those in real-time, to create a robust dashboard that supports strategic decisions and enhances business performance.
What is the future of executive dashboards?
What is the future of executive dashboards? With the power of trend forecasting and automated insights, these strategy dashboards will empower U.S. leaders to be proactive, not reactive.