KPIs for Lead Generation
Key Takeaways
- Monitor lead generation KPIs to determine the true success of your marketing initiatives and inform more intelligent business decisions.
- Keep an eye on engagement, lead activity, and conversion rates to improve the quality and volume of your leads. That will always produce the best results!
- Stick with basic KPIs such as cost per lead, lead conversion rate, and customer acquisition cost. They should inform your budgetary spend and allow you to pivot your strategy.
- Customize your KPI choices and benchmarks specific to your industry, sales funnel stages, and business objectives.
- Utilize your CRM and other analytics tools to ensure you’re tracking accurately, reporting clearly, and optimizing for performance on an ongoing basis.
- Continuously evaluate and adjust your KPIs to ensure they remain relevant to the evolving market landscape and help you optimize your lead generation efforts effectively.
Lead generation KPIs are measurable values that demonstrate how successfully a company is attracting potential customers. These key figures indicate if your marketing actions are working. They track the cost of generating each lead and show whether those leads turn into real sales.
In the United States, teams regularly monitor their success by measuring key performance indicators. They track cost per lead, conversion rate, and lead quality score. Utilizing these figures not only allows businesses to understand what’s working most effectively, but also where they’re losing potential customers.
Lead generation KPIs are used by both small teams and large enterprises. They leverage them to determine if their marketing spend is providing the expected return. In this guide, you’ll find out the best KPIs to track for lead generation. Stick around too to find out some tactics on how to leverage it and tips to avoid common kpi traps.
What Are Lead Gen KPIs?
Lead generation KPIs, or key performance indicators, are metrics that demonstrate the effectiveness of your lead generation efforts. These metrics essentially allow you to monitor what’s working and what requires a course correction. When you start tracking them, you start understanding how effective your marketing is—and where all your money is being spent.
Lead gen KPIs like total leads, Marketing Qualified Leads (MQLs), and Sales Qualified Leads (SQLs) are key indicators of your funnel’s overall health. They are like a yearly performance report card from top to bottom. They allow agencies and teams to establish measurable, attainable goals and identify opportunities for improvement to achieve better outcomes.
More Than Just Counting Leads
Measuring success by how many leads you receive is the easy way out. Lead quality is equally important. Turn to lead gen KPIs like lead scoring and conversion rate, for instance.
Beyond that, tracking how leads engage with your content will show you which leads are most likely to convert into customers. Metrics such as non-branded organic clicks or time on site can give you a better view of meaningful engagement, rather than just the volume. By paying attention to these specifics, you’ll be able to identify where your leads are falling off and address those weak points.
Your Business Growth Compass
KPIs should serve as a compass guiding your business. They guide you in determining how much money and time should be invested and where. To illustrate, KPIs such as cost per lead (CPL) and customer acquisition cost (CAC) can inform your strategy.
They show you exactly how much you’re spending to acquire each new customer. These figures need to align with your business’s overall objectives. Not only that, they allow you to compare past results to what you’re doing now, helping you figure out if your strategy’s working.
Linking KPIs to Real Goals
Link each KPI to a meaningful outcome. For example, if your objective is to increase sales, measure your lead conversion rate (LCR) and return on investment (ROI). Define concrete goals, such as increasing leads by 20% or decreasing CAC by 10%.
Return to these goals regularly, as the landscape you’re marketing in—and the needs of your business—will evolve.
Core Lead Generation KPIs Unpacked
Getting a handle on the proper KPIs will go a long way to making lead generation easier and more educational for both marketing departments and agencies. These figures go beyond padding a dashboard. They influence policy, point out success stories, and show how time and dollars are most effectively spent to get the biggest bang for the buck!
Every KPI provides a new perspective, allowing your teams to understand the overview as well as the underlying processes. By watching these core metrics, agencies and businesses can tweak campaigns, spot trends early, and build strategies that bring in steady, high-quality leads. Below, we unpack the lead generation core KPIs.
Below, we illustrate how each metric fits into a broader framework and walk you through how to start putting them to use.
1. Cost Per Lead (CPL) Focus
While cost per lead (CPL) is a pretty simple metric, it’s one filled with a ton of value. It’s the overall average cost you incur to acquire one lead. This is usually one of the first figures a team looks at to determine if their marketing dollars are going to good use.
To calculate CPL, simply take your total marketing spend and divide it by the number of leads generated in that time frame.
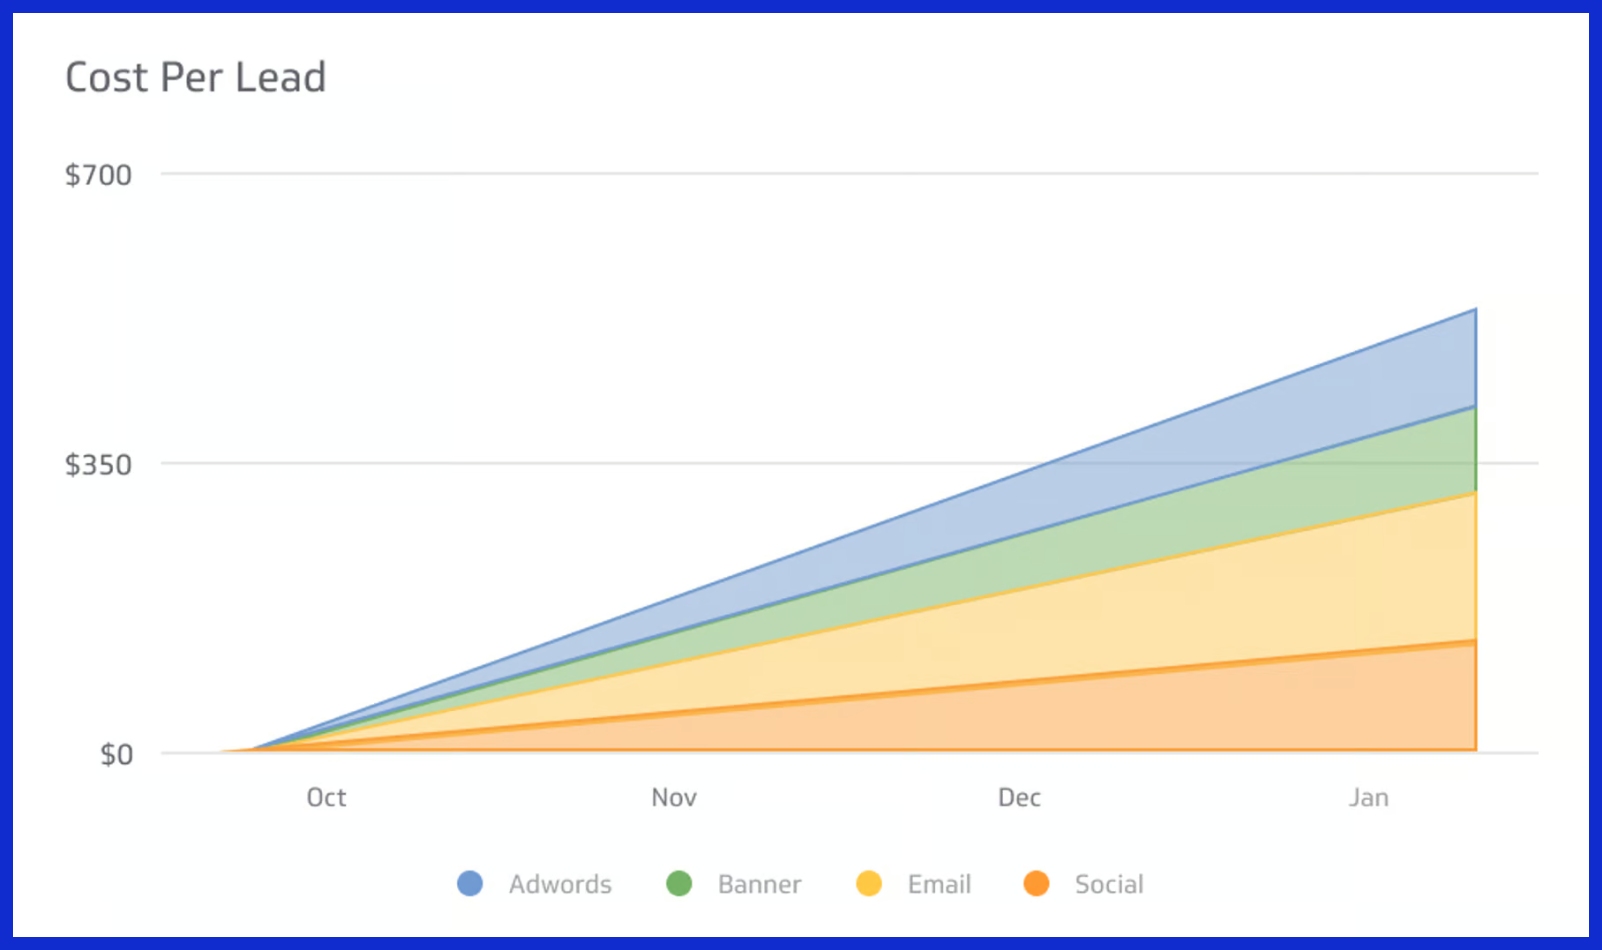
You can break down CPL by channel, like Google Ads, Facebook, or even direct mail. This will allow you to find out which channels produce leads at the cheapest cost.
For example, you may see that leads generated from organic search are cheaper than leads acquired through paid advertising.
Not to mention, LinkedIn drives more high-value leads despite the marginally higher CPL. This data is essential for future FY budget planning. This prevents wasted spend, allowing teams to reallocate budget to the channels that deliver the most value, resulting in more intelligent, effective campaigns.
2. Lead Conversion Rate (LCR)
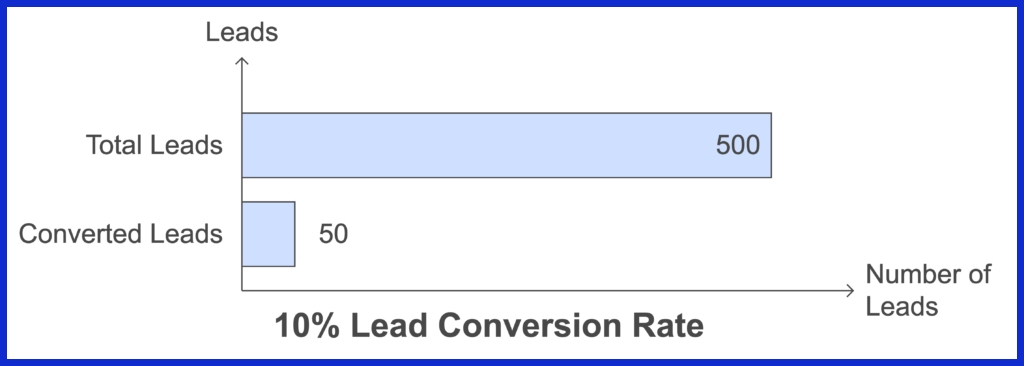
Lead Conversion Rate (LCR) is the percentage of leads that become paying customers. You can calculate it by taking the number of converted leads and dividing that by the total number of leads. Finally, multiply that number by 100.
If you received those same 500 leads and 50 of them turn into customers, your LCR would be 10%. LCR is a clear, no-nonsense way to show how well your sales process is working. It’s a measure of how effectively your marketing is reaching the right people!
Many factors can affect LCR. These are lead quality, follow-up response time from your sales team, and the offer-market fit, or how well your offer addresses your customer’s needs. By tracking LCR regularly, you can catch problems before they escalate.
A major decrease may mean that your landing page needs some serious attention or even that your messaging should be refreshed! Most teams establish conversion goals to encourage ongoing progress. When done on a regular cadence, these reviews create a feedback loop that continues to improve performance over time.
3. Customer Acquisition Cost (CAC)
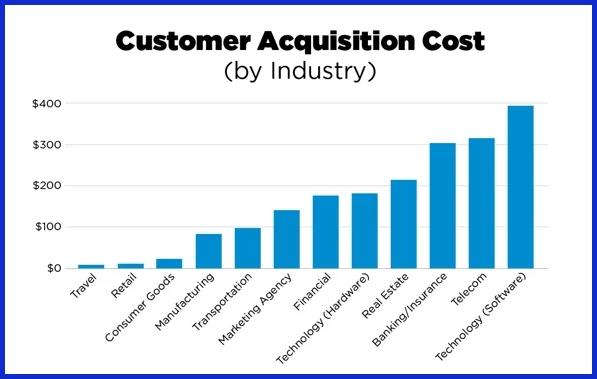
Customer acquisition cost (CAC) looks at the overall cost of acquiring a new customer. This accounts for all your lead-gen costs, including not just the cost to generate the lead, but also converting the lead into a paying customer. This includes everything: ad spend, sales team time, software, and even content production.
For example, if you spend a total of $5,000 and land 25 new customers, your CAC is $200.
This is the breakdown of how we got $200:
- Total Sales & Marketing Spend: $5,000
- Number of New Customers: 25
CAC = $5,000 ÷ 25 = $200 per customer
Comparing CAC to CLTV is essential for determining whether your lead generation is profitable. If CAC is high, but CLTV is significantly higher, then the model remains healthy.
If CAC starts to approach CLTV too closely, then it may be time to pivot. For SaaS businesses, especially, this balance is critical. Recurring revenue models really live and die by the ability to keep CAC under control and ensure healthy margins!
4. Customer Lifetime Value (CLTV)
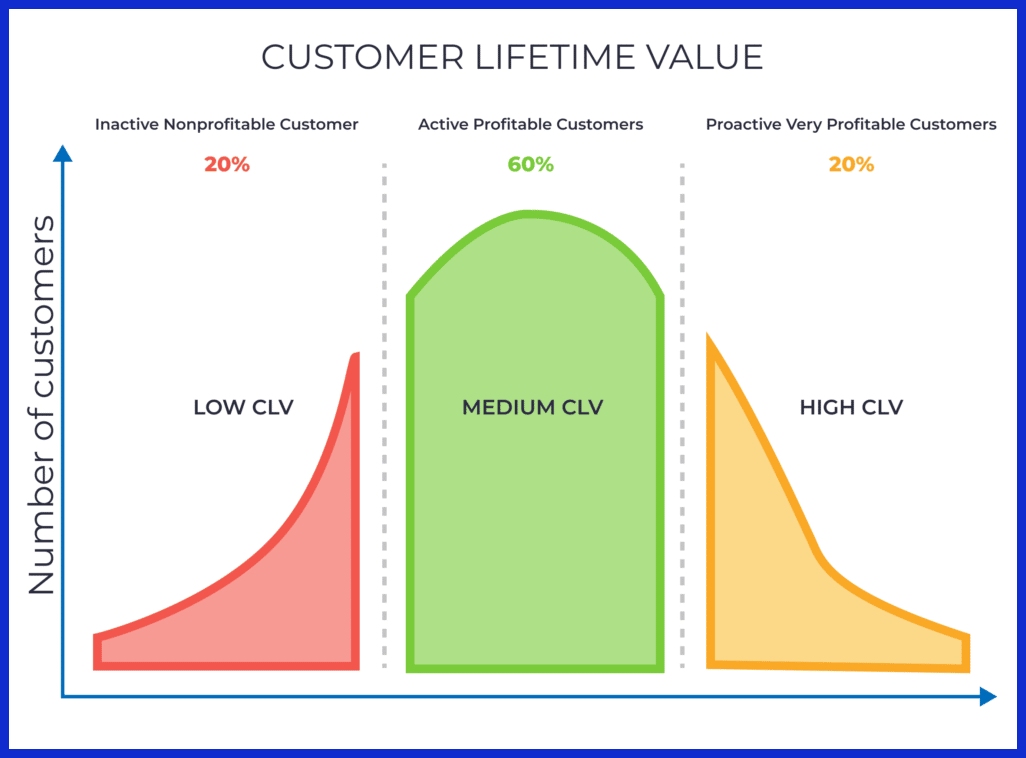
Customer lifetime value (CLTV) is the overall revenue a business anticipates from a single customer throughout their relationship. Understanding CLTV is crucial for teams to gauge lead generation performance and the long-term value of acquiring and keeping customers. It encompasses much more than just celebrating the immediate victory of a new lead acquired!
Calculating CLTV can be simple or complex, but the goal remains the same: identify which customers are worth the most and double down on finding more like them. By measuring CLTV, teams can focus on important lead generation KPIs and allocate more resources to the highest value segments.
If one specific lead generation channel is producing leads with the highest CLTV, consider investing more of your budget there. That’s your channel for tremendous returns on your investment! By creating more alignment between marketing and sales through CLTV, you’re enhancing sales efficiency and driving stronger ROI while maintaining the business’s focus on quality vs. quantity.
5. Marketing ROI Reality Check

Marketing ROI simply calculates how many dollars in revenue are returned for each dollar invested in marketing. This is the bottom-line number that most agencies and businesses care about—it indicates whether campaigns are paying for themselves.
Teams like to take a stab at ROI across channels, campaigns, or even content types to see what’s different and what might be the most effective. If you have a campaign that has a great CTR but low ROI, you might just need a new landing page or a more defined call-to-action.
By measuring ROI on a monthly basis, marketers are able to identify trends and make strategic adjustments to their tactics in real time. This never-ending process of testing and iterating not only keeps campaigns working efficiently and effectively, but also prevents unnecessary wasted spend.
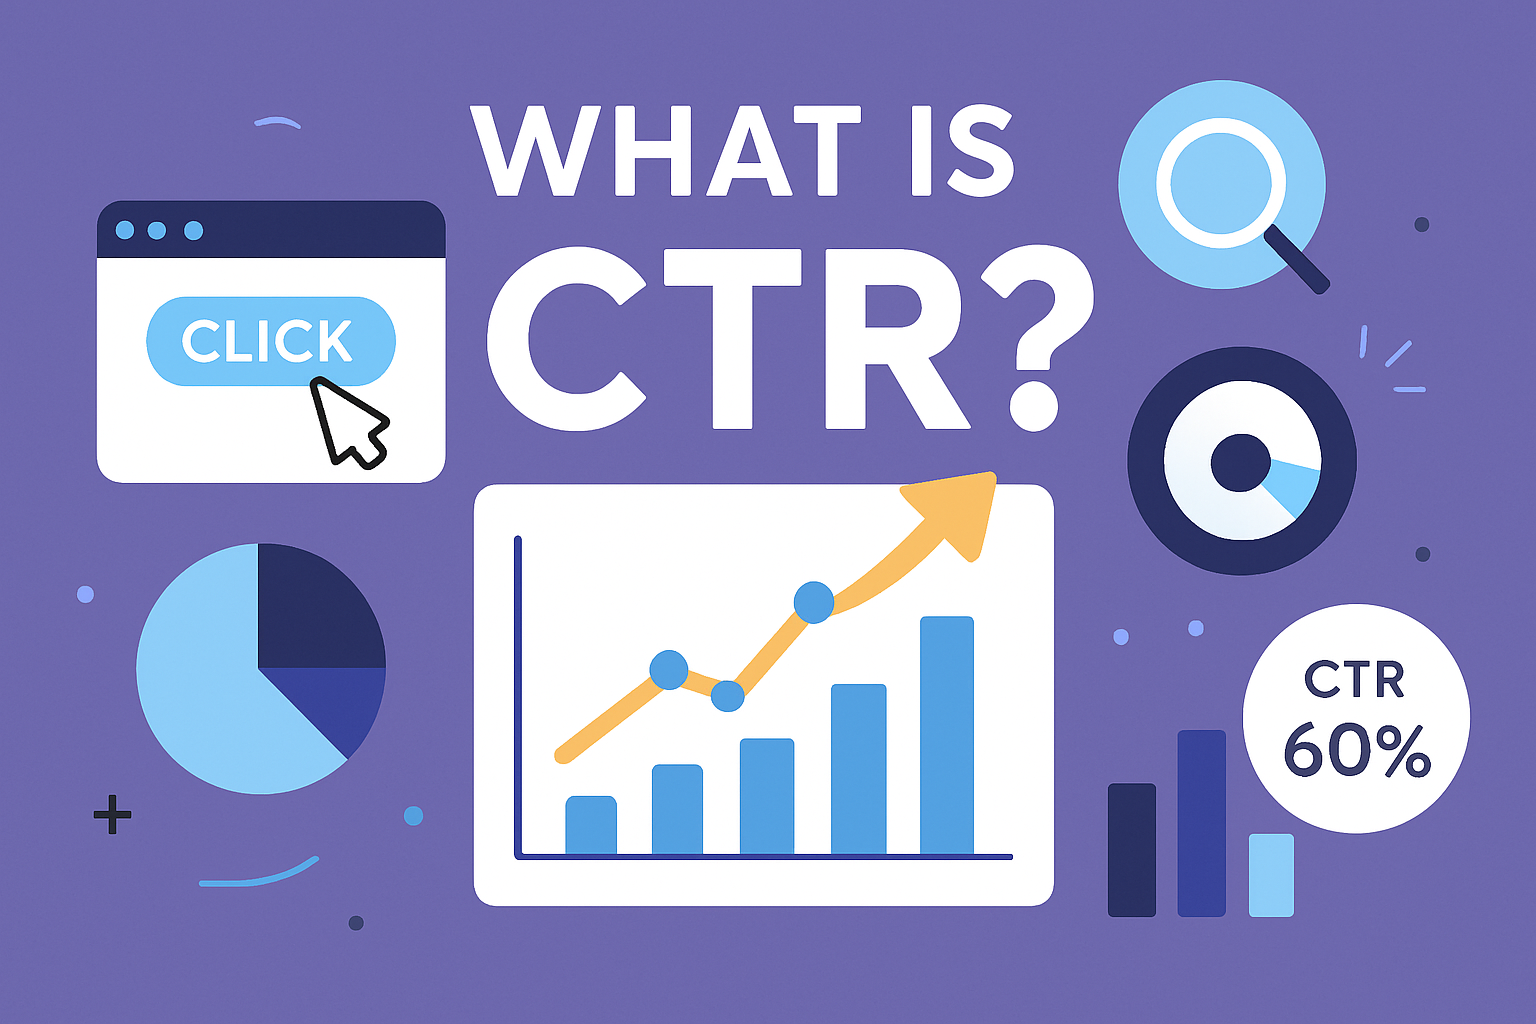
6. Click-Through Rate (CTR) Impact
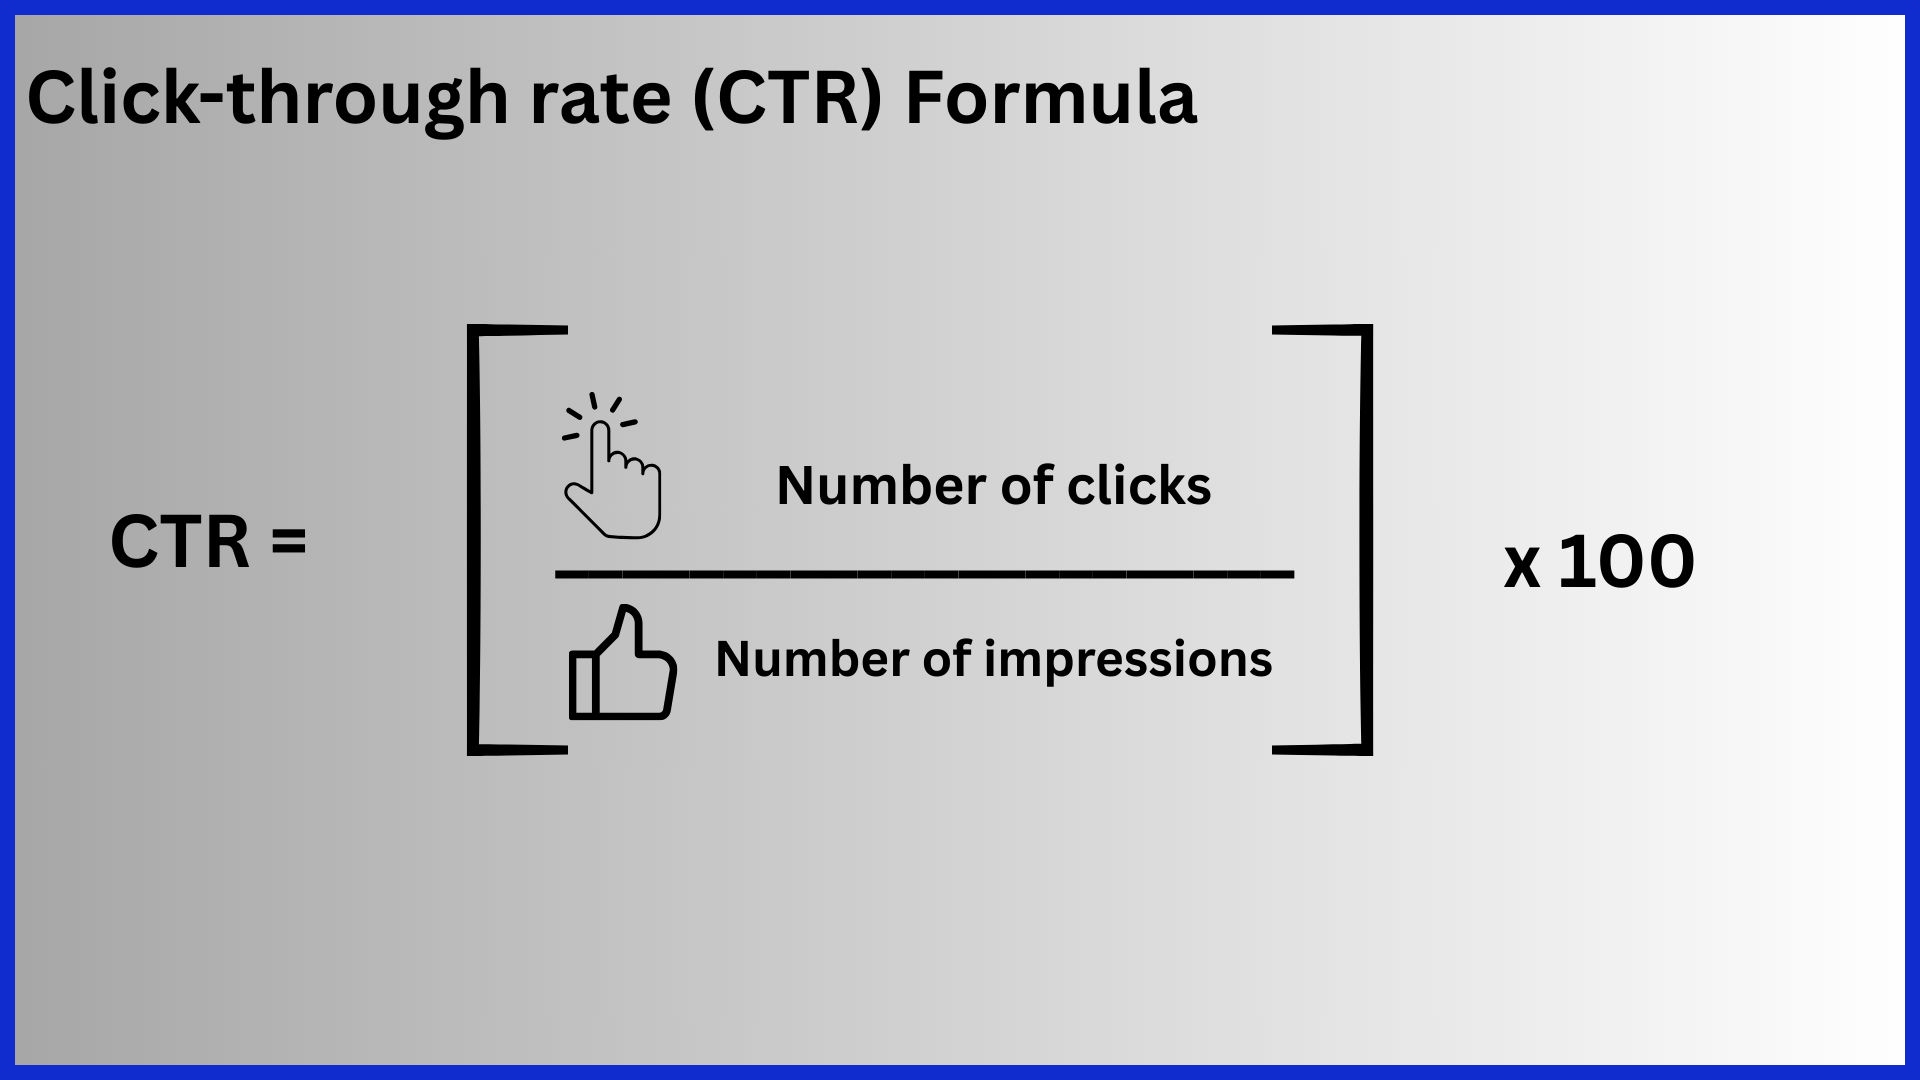
Click-through rate (CTR) is the number of people who clicked on your ad or link divided by the number of people who viewed it. It’s a positive initial indicator of engagement. A high CTR means your message is landing; a low CTR means it’s time to rethink your headline or offer.
CTR benchmarks vary depending on the channel. Paid search, for example, typically enjoys much higher CTRs than display. Marketing teams rely on this information to optimize copy, refresh visuals, and even create audience segments to deploy to the most relevant prospects.
Consistently monitoring CTR will help you keep your campaigns on point and your messaging relevant.
7. Landing Page Success Metrics
Landing page success metrics help you identify where leads are losing interest and how far down the funnel they’re willing to go. Bounce rate is another important stat—if it’s too high, that means visitors aren’t finding what they’re looking for.
Metrics such as average time on page and form fill abandonment rates are other indicators that paint a fuller picture of what’s working. Testing various headlines, layouts, and calls to action will help you maximize conversion rates.
Whether it’s a checklist—bounce rate, conversion rate, time on page—having a set of parameters makes it much easier to identify and address what’s broken. Most LEAD teams have a dashboard or basic Excel spreadsheet to track these figures and report out regularly.
At minimum, performing regular reviews of all these KPIs on a monthly basis will ensure your teams are proactively addressing issues and continuously optimizing. Teams that adopt dashboards and other simple tools will be poised to track what really matters with ease. This allows them to iterate and optimize for performance.
Select Your KPI North Stars
If your KPI North Star is lead generation, look for scores that indicate the real worth of your product or service. This new collaborative approach will deliver better outcomes and more powerful insights.
First, choose one North Star KPI that aligns with your overall business objective. This metric must be a rallying point for both teams as well as stakeholders. It could be customer acquisition cost, daily active users, or lead-to-customer conversion rate.
These figures are an indicator of how effectively you translate high interest into tangible business development.
Align KPIs With Your Funnel
It’s useful to align KPIs with each level of your funnel. For the top of the funnel, monitor website traffic or lead form submissions.
In between, track SQLs and sales calls. At the bottom of the funnel, look at your deal close rates. Each KPI should appropriately measure success for its funnel stage.
For instance, if many leads are falling out of the pipeline after a demo, that KPI indicates the need for optimization.
Factor In Industry Specifics
One size doesn’t fit all when it comes to business. Factor in industry specifics and use industry benchmarks to get a sense of where you stack up.
For those in SaaS, benchmarking your lead quality against others in technology will help. Keep an eye on what’s happening in the industry to ensure your KPIs remain timely.
Balance Lead Quantity & Quality
It doesn’t only matter how many leads you have. Implement lead scoring to identify the top-tier leads.
Lead quality vs quantity is crucial. Balance lead quantity and quality by watching not only how many leads you’re bringing in, but also how many convert to paying customers.
This provides a better overall picture.
Start Simple, Then Get Granular
Start simple, then get granular. Once you’re comfortable with those, layer in more granular KPIs. Start with your KPIs, and ensure you know them inside and out.
Measure KPIs: Tools & Tactics
Consistent, high-quality lead generation begins with identifying your key lead generation KPIs and choosing the right tools to measure them effectively. The reality is that most marketing teams across the U.S. still rely on CRMs, analytics dashboards, and spreadsheets, but the true lead generation performance comes from how these tools are configured and implemented.
Maximize Your CRM’s Potential
A good CRM system is a great way to track touchpoints for each lead, including call notes and emails. Create tailored dashboards to showcase key metrics such as engagement rate, conversion rate, and cost per lead. That way, you’re not wasting your team’s time on the things that don’t matter!
Provide comprehensive training for everyone on best practices for data entry. Bad data can result in faulty reports and make it more difficult to act quickly on important decisions. For starters, your CRM marks each new contact as a lead by default. You’ll need rules to filter out the duplicates or non-qualified leads!
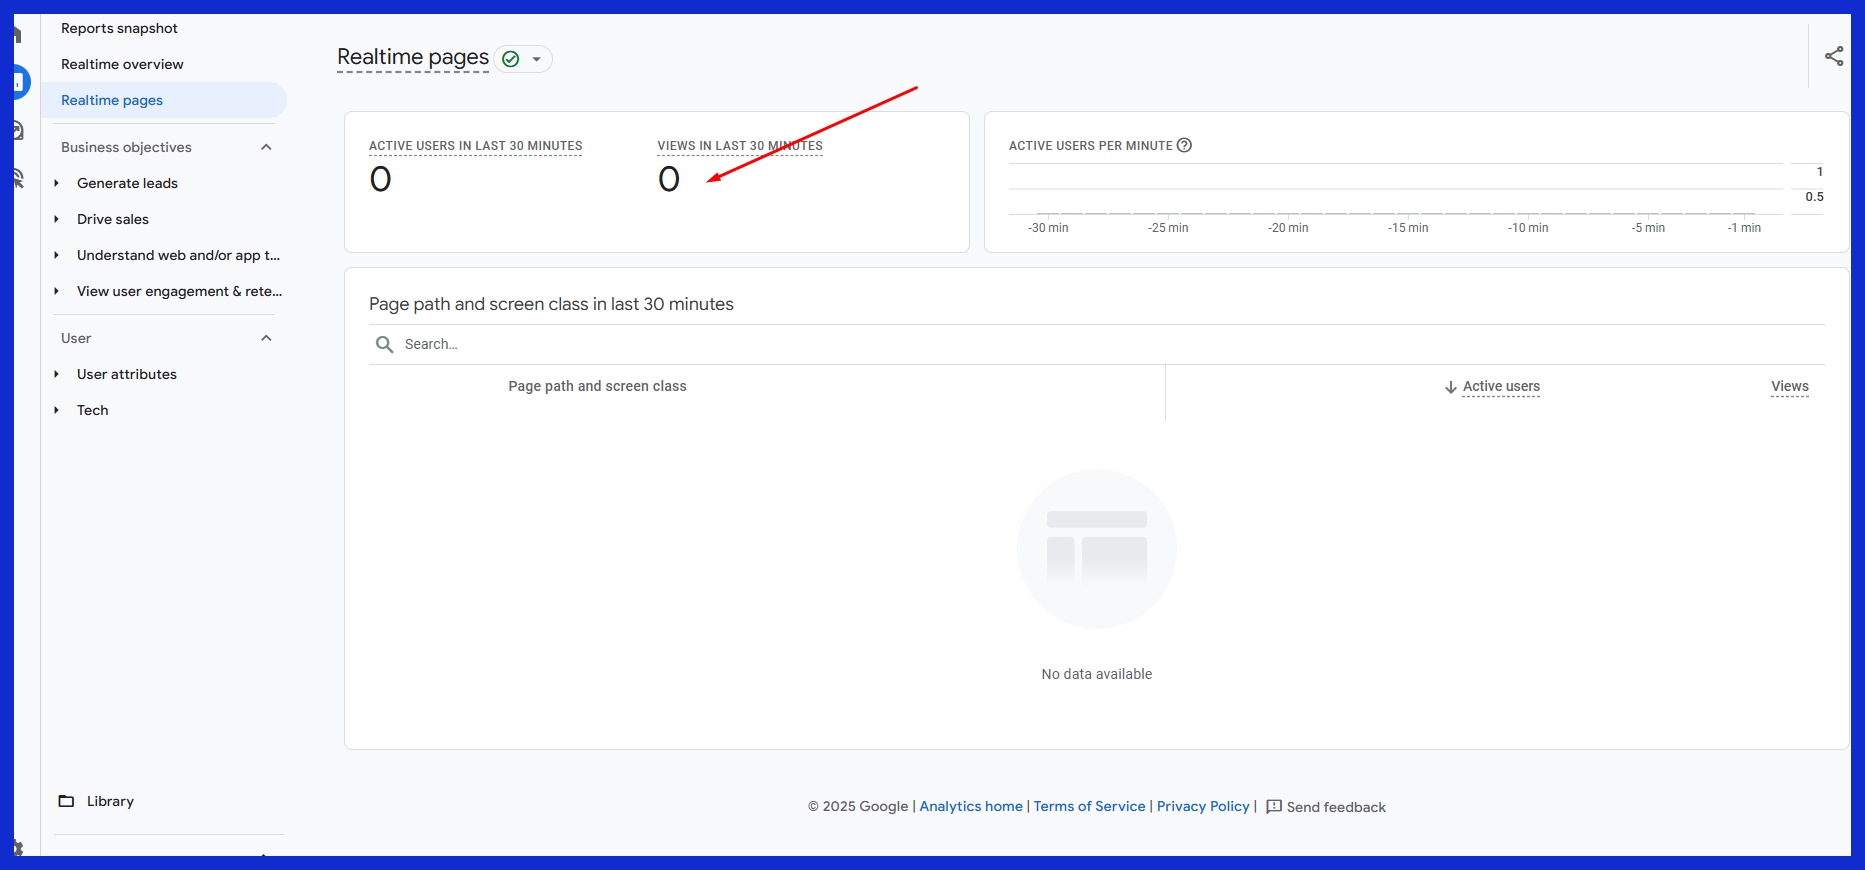
Use Analytics Platforms Smartly
Both Google Analytics and other analytics tools can give teams a clearer picture of what channels and pages are driving leads. Create specific reports that measure the most important KPIs, like average session duration or CTR.
Use simple graphs or charts to share data with the team—most marketers find visuals make trends easier to spot. Excel or Google Sheets are great tools for running post-campaign performance reviews, particularly when it comes to budget tracking.
Ensure Accurate Attribution Tracking
These attribution models allow you to see what sources—social ads, SEO, etc. Multi-channel tracking ensures you see the entire journey users go on before they convert.
Review attribution data regularly. This will allow you to move funds around to the top-performing campaigns. Say, for instance, your average conversion rates start falling below 1%. Investigate the source of traffic and content type to cross-reference data for clarity.
Establish Regular Reporting Cadence
Establish a Regular Reporting Cadence. Determine if you will report KPIs weekly, monthly, or according to some other schedule. Distribute those reports to stakeholders to ensure continued buy-in from everyone involved.
Utilize these sessions to celebrate wins, recognize places to grow, and recalibrate KPIs as business goals evolve.
Data to Decisions: Optimize Now
Lead generation is about building relationships, not moving the needle. It’s about looking at where your process is failing. Engage data to identify those vulnerabilities, and then go out with a plan to explicitly address them!
Being smart about the choices we make is key to all of this. Data provides the clarity—what’s working, what’s not, where you’re headed, and where you need to pivot.
Find Bottlenecks, Fix Leaks

Begin by identifying where leads drop out. Perhaps it’s poor response rates on email, or leads walking away after a product demonstration. Identify your biggest pain points using your KPIs to identify these pain points.
Or maybe your conversion rate from landing page to demo request is pitiful—there’s an obvious indicator. It’s time to adjust your message or your application fields! Get into the nitty gritty and identify where your data is leaking, such as emails not opened or ads not clicked.
Now that you’ve found the leaks, get ready to work on data-driven solutions! Work on developing more concise applications, more obvious calls-to-action, and better timing of your follow-up.
A/B Test for Better Results
A/B testing is a straightforward method to test two distinct versions of a campaign and determine which is more effective. Run tests on varying subject lines, landing pages, or offers entirely.
Document what you learn, and apply those lessons to future campaigns. Cumulatively, this creates a deep knowledge base that informs future decisions, helping them become easier and more effective.
Sharpen Your Lead Scoring
Lead scoring helps you rank your leads from best to worst. Improve it by incorporating additional signals such as web traffic or email activity.
Keep re-scoring as the market changes, giving your sales team the highest quality leads at all times.
Streamline Sales Handoff Process
An optimized sales handoff process results in fewer lost leads. Create firm guidelines for when and why leads are passed from one team to another.
Track your sales handoff conversion rates and adjust your process so leads don’t fall through the cracks.
Avoid These Common KPI Traps
Just tracking important lead generation KPIs related to lead generation performance gives you a pretty limited view. Some traps can skew or obscure the true narrative in your data. It’s a no-brainer, but what are the right lead generation metrics that smart teams decide to track? They understand how to interpret them, which saves time and prevents missed development opportunities.
Chasing Superficial Vanity Metrics
Another major KPI pitfall is placing excessive emphasis on vanity metrics. Website pageviews, social media likes, or downloaded whitepapers paint a pretty picture but rarely indicate anything about the quality of leads or sales.
Take, for example, the increased traffic resulting from a post that goes viral—great for brand awareness, but not necessarily creating qualified leads. Instead of teams worrying whether leads are coming in at the right conversion rate, cost per lead, or pipeline value, these KPIs help you gauge the effectiveness of your efforts at driving tangible business.
By teaching your teams about the importance of meaningful numbers, you’ll ensure that everyone is focused on achieving true progress, rather than just prettier reports.
Overlooking Qualitative Insights
Qualitative insights are necessary. Numbers alone can’t tell the story. Qualitative feedback—like why a lead chose to talk to sales, or what stopped them from signing up—can explain trends that stats miss.
Gathering qualitative feedback with short surveys, user interviews, or even through live chat allows teams to identify friction points and update messaging or offerings accordingly. These insights inform more effective lead generation strategies and ensure campaigns remain aligned with evolving audience preferences.
Setting and Forgetting KPIs
KPIs quickly lose their value if they are not adapted to changing circumstances – ideally, every month. After all, markets change, products change, and your goals change.
Having a monthly review process ensures that they remain dynamic and relevant to what the business needs today. When teams adapt indicators, they can spot issues early and act fast instead of waiting for quarterly or yearly reviews. Closing this loop prevents the “firefighting leftovers” issue, where solutions carved out for a previous crisis get institutionalized.
Misreading Your Data Signals
Misreading your data signals can lead to poor decisions, especially when it comes to important lead generation metrics. Making incorrect interpretations is a surefire way to hinder lead generation success. Educating teams on how to interpret trends and verify findings through independent checks can prevent errors in lead generation performance.
A simple example: a dip in lead volume could be seasonal, not a sign that something’s broken in your lead generation strategy. Smart reports present clean, simple, and targeted data, allowing teams to easily identify key lead generation KPIs without getting lost in unnecessary details.
When stakeholders can’t seem to agree on crucial KPIs, having honest conversations can ensure everyone’s goals are met, leading to actionable reports and better alignment in lead generation campaigns.
Conclusion
To generate leads that matter, focus on KPIs that truly support your goals, like cost per lead, lead quality, and conversion rate. These metrics show real progress, not just surface-level stats.
Stick to tools that are easy to use, so you can track what’s working and make quick tweaks as needed. Skip the vanity metrics and zero in on what drives high-quality leads.
For example, a local agency might track how many demo requests come in from paid ads each week. Keep it simple, stay consistent, and focus on meaningful results. The right KPIs cut down on busywork and help you win more often.
Want to save time with automated reports that gather all your lead gen data in one place? Give KPI.me a try—built to measure results, not just effort.
Frequently Asked Questions
What are KPIs in lead generation?
What are KPIs in lead generation? KPIs, or Key Performance Indicators, are essential metrics that demonstrate the effectiveness of your lead generation marketing campaigns. They ensure that you’re tracking the right lead generation metrics and constantly optimizing your marketing efforts.
Which KPIs matter most for lead generation?
Key KPIs to track
Consider tracking the following: cost per lead, lead conversion rate, lead quality score, and time to conversion. As a result, these KPIs indicate the quality of your top-of-the-funnel lead generation efforts.
How do I choose the right KPIs for my business?
Choose important lead generation KPIs that align with your objectives and sales cycle. For instance, if your goal is to generate more high-quality leads, measure key lead generation metrics such as lead conversion rates.
What tools do I need to measure lead gen KPIs?
Sales CRMs such as Salesforce or HubSpot, along with Google Analytics and lead tracking software, simplify gathering and interpreting data on your lead generation metrics and key lead generation KPIs.
How often should I review my lead gen KPIs?
How often should I check my lead generation metrics? Consistent monitoring of important lead generation KPIs enables you to identify trends sooner rather than later and steer your lead gen campaigns in the right direction for maximum output.
What’s a common mistake when tracking lead gen KPIs?
A common mistake when tracking lead generation metrics is to stop counting leads; instead, focus on whether these qualified leads are converting into customers.
How can optimizing KPIs improve my lead generation?
By optimizing important lead generation KPIs, you can identify your successes and failures. This approach allows you to double down on the strongest lead generation channels, reduce wastage, and maximize leads with the highest quality.