From Impressions to Conversions: A Complete Organic Traffic Report Example
Imagine handing a client or your executive team a report that doesn’t just display a wall of raw data, but actually tells a compelling story. A story that begins with someone typing a question into Google and ends with that person becoming a loyal customer.
That is exactly what a well-structured organic traffic report does. It illustrates how users discover your site via search, what actions they take once they arrive, and how many ultimately convert—perfectly closing the loop between SEO efforts and bottom-line revenue.
Here is the blueprint for a complete, story-driven organic traffic report broken down by funnel stages.
The Journey Begins: Top of Funnel (Search Discovery)
Every customer journey starts somewhere, and for organic traffic, it begins with a search query. This section answers a fundamental question: “How visible are we in the search landscape?”
Total Impressions (Site) [GSC]
![Total Impressions (Site) [GSC]](https://kpi.me/wp-content/uploads/2026/07/p1.png)
Think of impressions as your brand appearing on a digital billboard. This shows how many times your site flashed in front of searchers’ eyes. Even if they didn’t click, you were there. Growing impressions means expanding your digital footprint.
Top Impressions (Query) [GSC]
![Top Impressions (Query) [GSC]](https://kpi.me/wp-content/uploads/2026/07/p2.png)
The actual words people typed before your site appeared. This tells you what topics the search algorithms associate with your brand. If these aren’t the right topics, your content strategy needs adjustment.
Top Impressions (Pages) [GSC]
Which pages are getting the most billboard time? This reveals your most visible content. It might be your homepage, or it could be a blog post from three years ago that suddenly gained traction.
Top Impressions (Countries) [GSC]
Geography matters. Are you visible in your target markets? You might find you are getting massive impressions in a country you don’t even ship to, signaling a need to adjust your geo-targeting.
Top Impressions (Devices) [GSC]
![Top Impressions (Devices) [GSC]](https://kpi.me/wp-content/uploads/2026/07/3.png)
Mobile or desktop? This tells you where your search visibility is strongest. If you are getting mostly mobile impressions but your mobile site is slow, you have a critical bottleneck.
Average Position (Site) [GSC]
![Average Position (Site) [GSC]](https://kpi.me/wp-content/uploads/2026/07/6.png)
The average ranking across all your keywords. While a broad metric, a consistently rising position (a lower number) means you are winning the long-term visibility game.
The Click: Middle of Funnel (Traffic Acquisition)
Visibility only becomes valuable when someone takes action. This section tracks the crucial moment a passive searcher transitions into an active site visitor.
Top Clicks (Query) [GSC]
![Top Clicks (Query) [GSC]](https://kpi.me/wp-content/uploads/2026/07/p5.png)
Which search terms actually drive traffic? You might get thousands of impressions for broad terms, but actual clicks for specific, high-intent phrases. This separates the lookers from the buyers.
Top Clicks (Pages) [GSC]
Where do people land when they click? This highlights your hardest-working entry pages—the ones successfully converting searchers into visitors.
Organic Search Traffic [GA4]
![Organic Search Traffic [GA4]](https://kpi.me/wp-content/uploads/2026/07/p6.png)
The hand-raisers have officially arrived. This counts actual sessions originating from organic search, acting as the bridge between what happens on Google and what happens on your site.
Users vs. New Users (Organic) [GA4]
Are these fresh faces or returning visitors? New users mean your SEO is expanding your reach, while returning users mean your content is sticky. Both tell valuable, distinct stories.
Sessions by User Type (Organic) [GA4]
![Sessions by User Type (Organic) [GA4]](https://kpi.me/wp-content/uploads/2026/07/p7.png)
A deeper look at the new versus returning dynamic to help you monitor audience loyalty and growth ratios clearly.
The Experience: Middle of Funnel (On-Site Engagement)
Getting them to the door is one thing; getting them to stay is another. This section proves that your organic traffic isn’t just empty volume—it is high-quality engagement.
Views by Page Title [GA4]
![Views by Page Title [GA4]](https://kpi.me/wp-content/uploads/2026/07/p8.png)
Segmented for organic. Once they land, do they explore? This shows which pages organic visitors actually read. If they land on a blog post and then visit three more, you have a winning content loop.
Landing Page Performance [GA4]
![Landing Page Performance [GA4]](https://kpi.me/wp-content/uploads/2026/07/p9.png)
The full picture of first impressions. By looking at bounce rate, engagement rate, and session duration for entry pages, you can easily diagnose technical or content problems.
Engaged Sessions (Organic) [GA4]
![Engaged Sessions (Organic) [GA4]](https://kpi.me/wp-content/uploads/2026/07/p10.png)
Google defines an “engaged” session as one that lasts more than 10 seconds, has a conversion, or includes multiple pageviews. This filters out accidental clicks and shows you the real, quality traffic.
Engagement Rate (All Traffic) [GA4]
![Engagement Rate (All Traffic) [GA4]](https://kpi.me/wp-content/uploads/2026/07/p11.png)
Is your organic traffic more engaged than your social or paid traffic? Comparing these channels tells you exactly where your highest-quality users come from.
Average Session Duration [GA4]
![Average Session Duration [GA4]](https://kpi.me/wp-content/uploads/2026/07/p12.png)
Time on site. If organic visitors are staying longer than your site average, your SEO content is highly relevant and resonating.
User Stickiness (Organic) [GA4]
Do organic visitors come back? If your organic traffic is sticky, your SEO is actively building an audience, not just capturing fleeting clicks.
The Payoff: Bottom of Funnel (Conversions & Revenue)
This is why we do SEO. This section connects every impression, click, and visit to the metrics that pay the bills.
Total Revenue (Organic) [GA4]
![Total Revenue (Organic) [GA4]](https://kpi.me/wp-content/uploads/2026/07/p23.png)
How much money did organic search generate? Full stop. This is the ultimate bottom-line number.
Revenue: All Traffic vs. Organic Traffic [GA4]
![Revenue: All Traffic vs. Organic Traffic [GA4]](https://kpi.me/wp-content/uploads/2026/07/p14.png)
What percentage of total revenue comes from “free” traffic? When organic revenue grows faster than total revenue, your SEO ROI is thriving.
Ecommerce Purchases by Item Name [GA4]
![Ecommerce Purchases by Item Name [GA4]](https://kpi.me/wp-content/uploads/2026/07/p15.png)
Which products do organic searchers actually buy? You might rank well for one product category but find that visitors actually purchase a completely different one.
Top Selling Products (Organic) [GA4]
![Top Selling Products (Organic) [GA4]](https://kpi.me/wp-content/uploads/2026/07/p16.png)
The organic best-seller list. Merchandising and content teams use this to promote proven winners heavily.
Transactions: All vs. Organic [GA4]
![Transactions: All vs. Organic [GA4]](https://kpi.me/wp-content/uploads/2026/07/p17.png)
A volume story. Sometimes organic revenue is high because of a few big-ticket items; sometimes it’s high because of a massive volume of small transactions.
Revenue per Country / Age / Gender [GA4]
![Revenue per Country / Age / Gender [GA4]](https://kpi.me/wp-content/uploads/2026/07/p18.png)
Demographics and geography meet dollars. If a specific country or age group drives 80% of your organic revenue, you know exactly how to tailor your future marketing strategies.
The Audience: Who We’re Talking To
Before closing the report, it helps to humanize the data and remind stakeholders exactly who they are reaching.
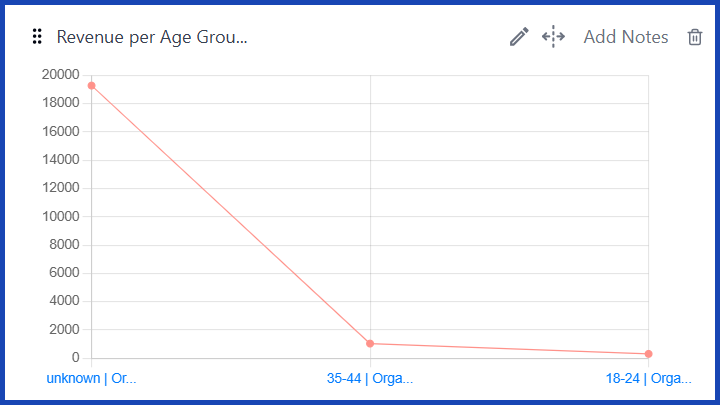
Users by Age (Organic) [GA4]
![Users by Age (Organic) [GA4]](https://kpi.me/wp-content/uploads/2026/07/p21.png)
Are you actually reaching the generation you built your marketing personas around?
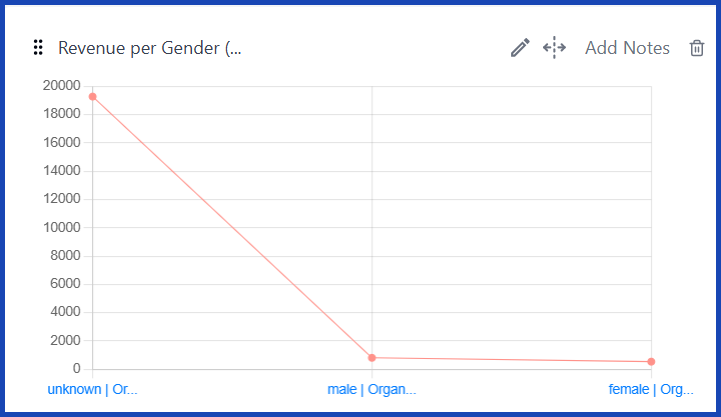
Users by Gender (Organic) [GA4]
![Users by Gender (Organic) [GA4]](https://kpi.me/wp-content/uploads/2026/07/p22.png)
Another layer of demographic depth to validate your audience targeting.
Users by Country (Organic) [GA4]
![Users by Country (Organic) [GA4]](https://kpi.me/wp-content/uploads/2026/07/11.png)
The geographic breakdown of your audience to ensure alignment with your operational reach.
Sessions by Device Category [GA4]
![Sessions by Device Category [GA4]](https://kpi.me/wp-content/uploads/2026/07/p24.png)
How they access your site. If your organic audience is overwhelmingly on mobile devices, optimizing the mobile experience becomes your top technical priority.
Conclusion
A truly effective organic traffic report does not just list metrics; it connects the dots. By organizing your data from initial discovery all the way through to final revenue, you provide stakeholders with a clear, actionable narrative that proves the undeniable business value of SEO.
However, building this narrative shouldn’t require hours of manual data entry or wrestling with complicated spreadsheets. This is where a dedicated reporting platform like KPI.me becomes invaluable. By seamlessly integrating your Google Search Console and GA4 data into one clean, automated dashboard, KPI.me allows you to effortlessly construct these story-driven reports. Instead of getting bogged down in pulling numbers, you can spend your time delivering the actionable insights that drive real business growth.