Reporting vs Analytics vs Insights: How to Use Each for Smarter Decisions
Key Takeaways
- Reporting is the traditional practice of data metrics and tells you what has already occurred in your business. Analytics goes a step deeper to understand why it happened, and insights tell you what you should do next.
- Effective use of all three components—reporting for tracking, analytics for understanding trends, and insights for guiding strategy—enables more informed and confident decision-making.
- Whereas regular, accurate business reporting fosters a culture of transparency and accountability among teams, analytics and insights empower teams to drive growth and innovation.
- Bringing together data from multiple sources and fostering collaboration between technical, analytical, and strategic roles improves business performance as a whole.
- Leveraging technologies like artificial intelligence and machine learning can streamline data analysis and surface deeper, actionable patterns for competitive advantage.
- To get started, organizations need to focus on quality data. They need to commit to continuous upskilling and keep their teams aligned on what data-informed action is doing to further their business goals.
Reporting, analytics, and insights are the three core pillars of modern data-driven marketing and business strategy. Each plays a distinct role in how teams understand and act on data in real-world settings.
Reporting presents the raw numbers—usually in the form of charts, graphs, or tables—to show what has happened. It answers the question: “What occurred?”
Analytics digs deeper by examining that data to uncover patterns, trends, and causes. It helps teams figure out “Why did it happen?”
Insights take things a step further. They add context and meaning to the analysis, guiding decision-makers toward what actions to take next to improve performance or seize new opportunities.
In today’s fast-moving U.S. business landscape, understanding the difference between reporting, analytics, and insights is essential. It empowers marketing agencies and SaaS buyers to choose the right tools, build smarter strategies, and deliver better results.
In the sections below, we’ll break down how each element works, what sets them apart, and why using them together leads to stronger, data-informed decisions.
What is Business Reporting?
Business reporting helps turn thousands of data points into easy-to-read summaries. These reports show what’s been happening in a company over a set time, like a week, a month, or a quarter.
They give teams a clear picture of how close they are to reaching their goals, using simple metrics like sales, website traffic, or conversion rates. Instead of digging through endless spreadsheets, reports present the data in charts, tables, or dashboards, making trends easy to spot.
Regular reporting cycles also help track progress over time, so teams can quickly see what’s improving and what needs attention.
Defining Basic Reporting
Basic reporting involves pulling data from multiple sources—point of sale systems, online store dashboards, or customer relationship management (CRM) tools. This data is then visualized in a way that’s quickly digestible and easy to read.
This tool offers an on-the-spot snapshot of the business’s health. It usually relies on basic visual tools such as spreadsheets or dashboards. Through their production, these reports provide a fascinating glimpse into the state of play.
They only serve as a launchpad to answer the questions, “What is happening?” and “Why is this important?
Why Reporting Still Matters

Reporting helps ensure that we are all aiming for the same thing. It allows executives and teams alike to track progress, identify trends, and identify issues or anomalies.
By communicating outcomes consistently, reporting fosters a culture of trust and accountability within organizations. Regular reporting keeps the spotlight on successes and shortcomings.
Common Reporting Examples
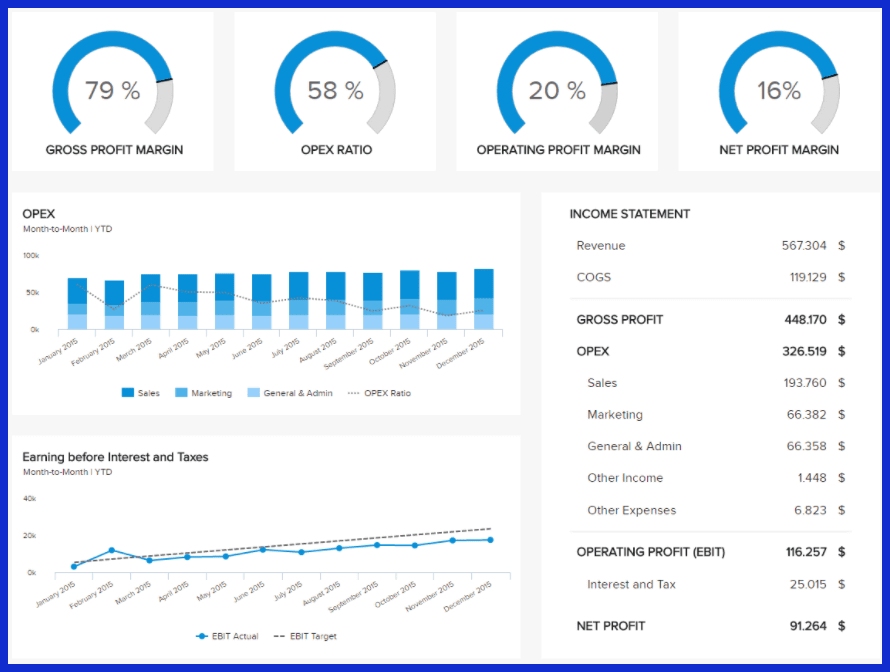
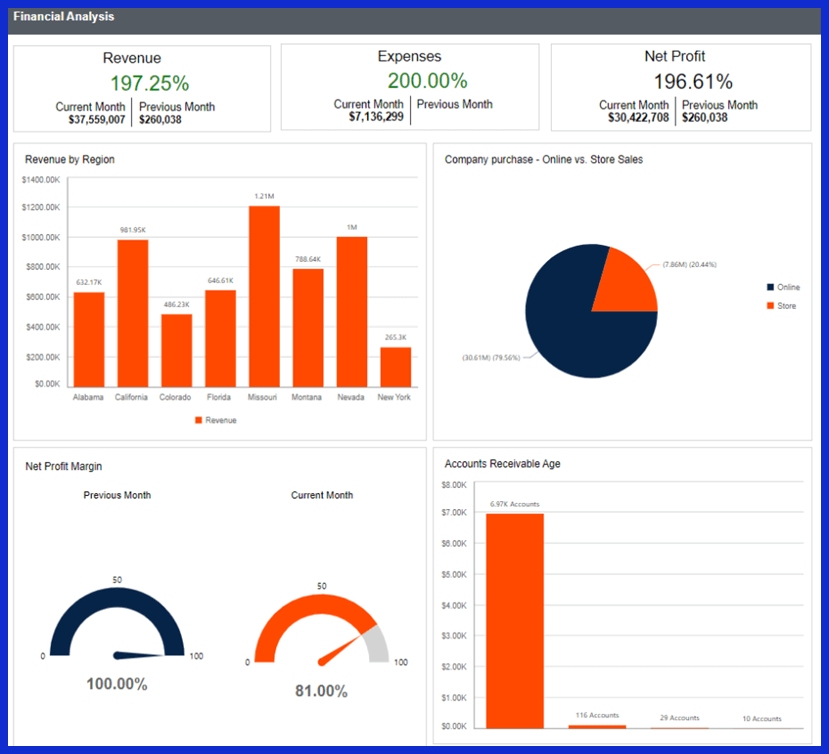
- Financial reports
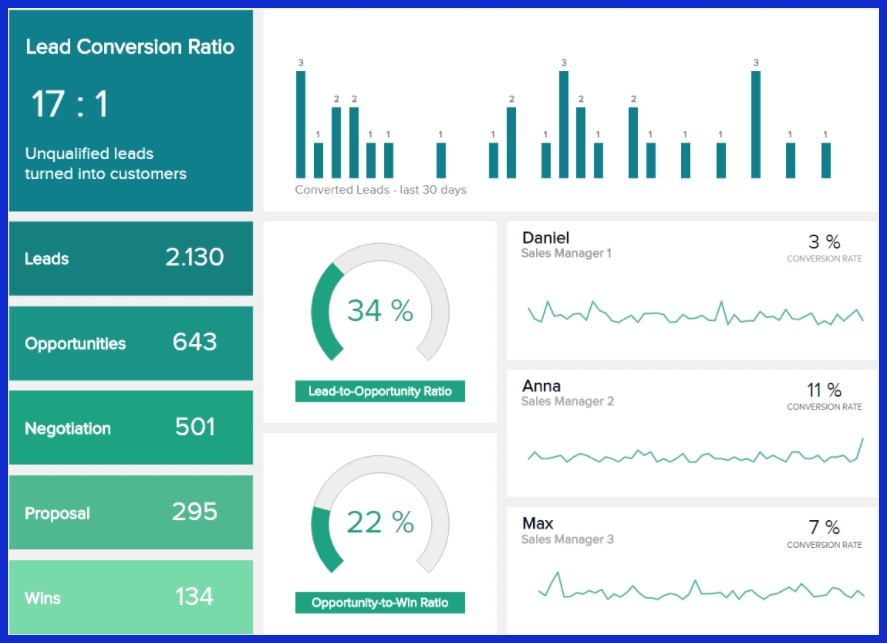
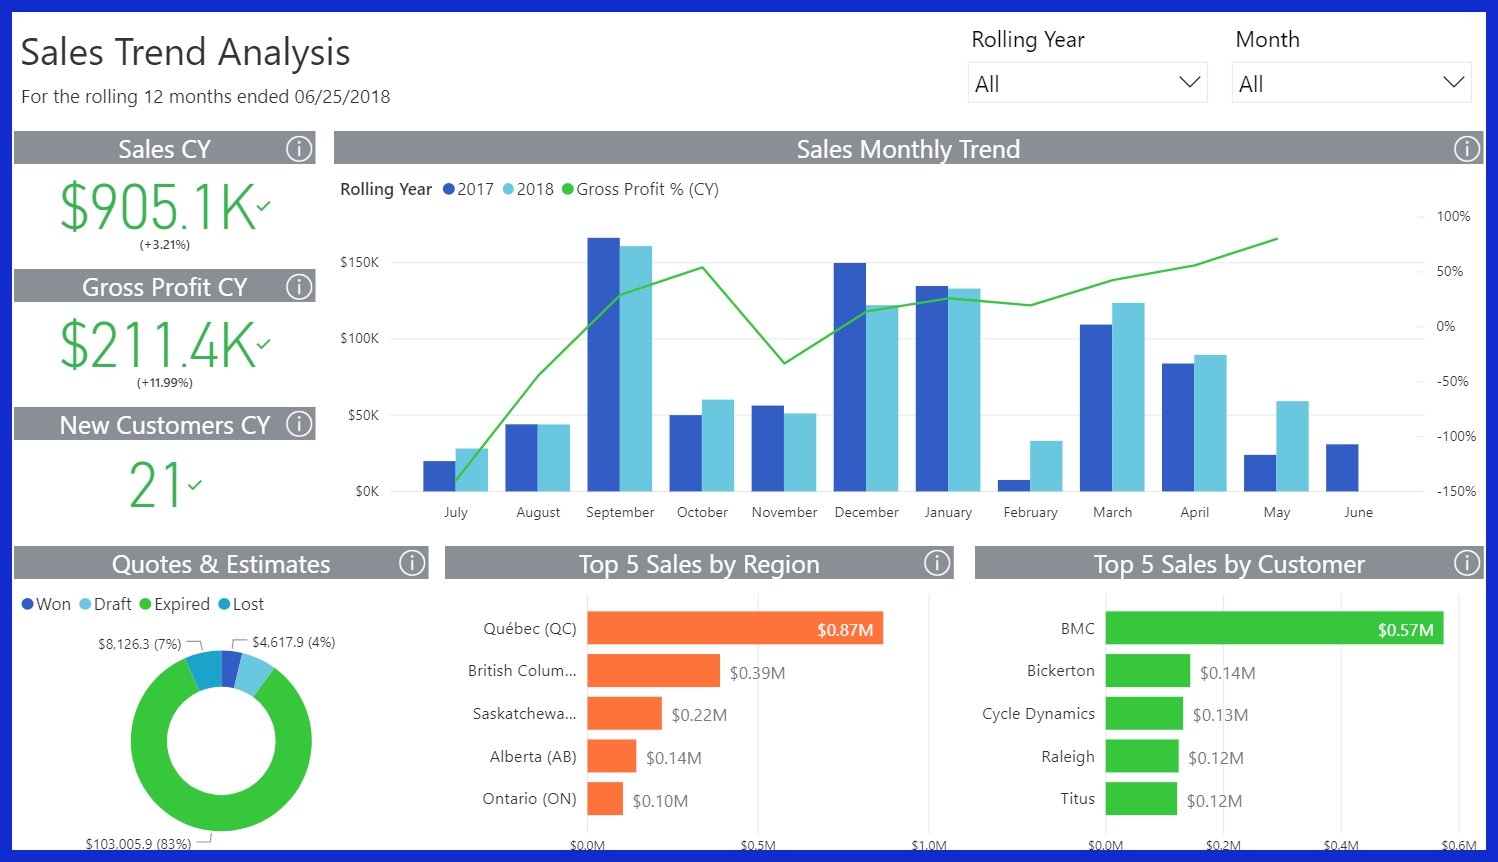
- Sales reports
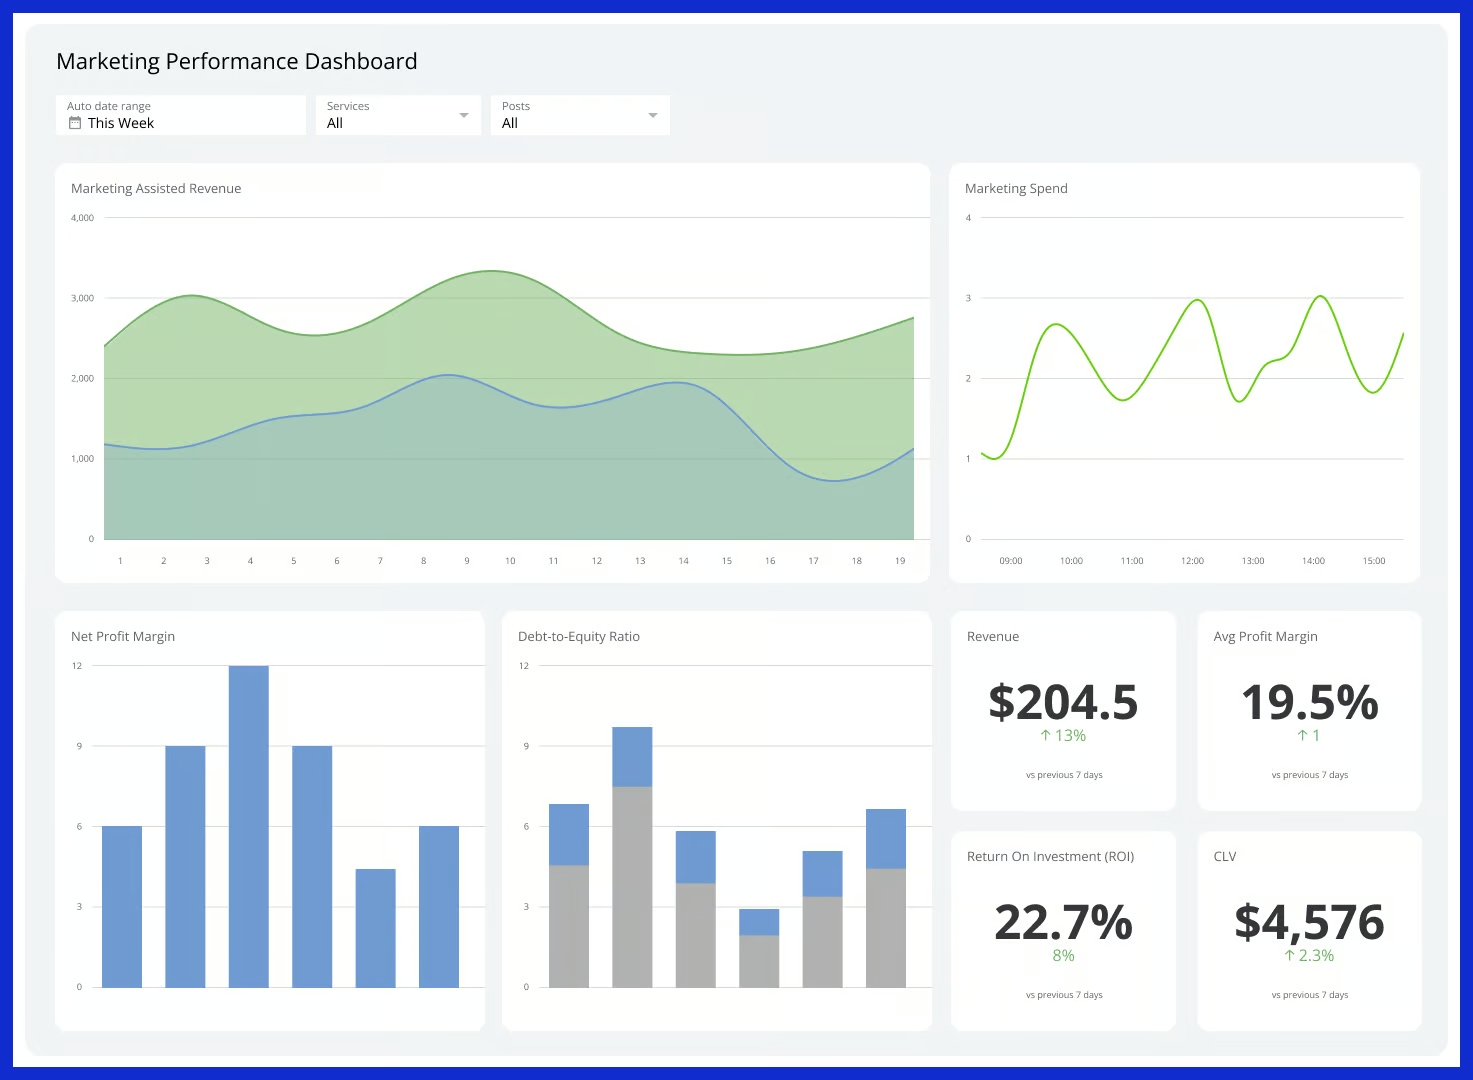
- Marketing dashboards
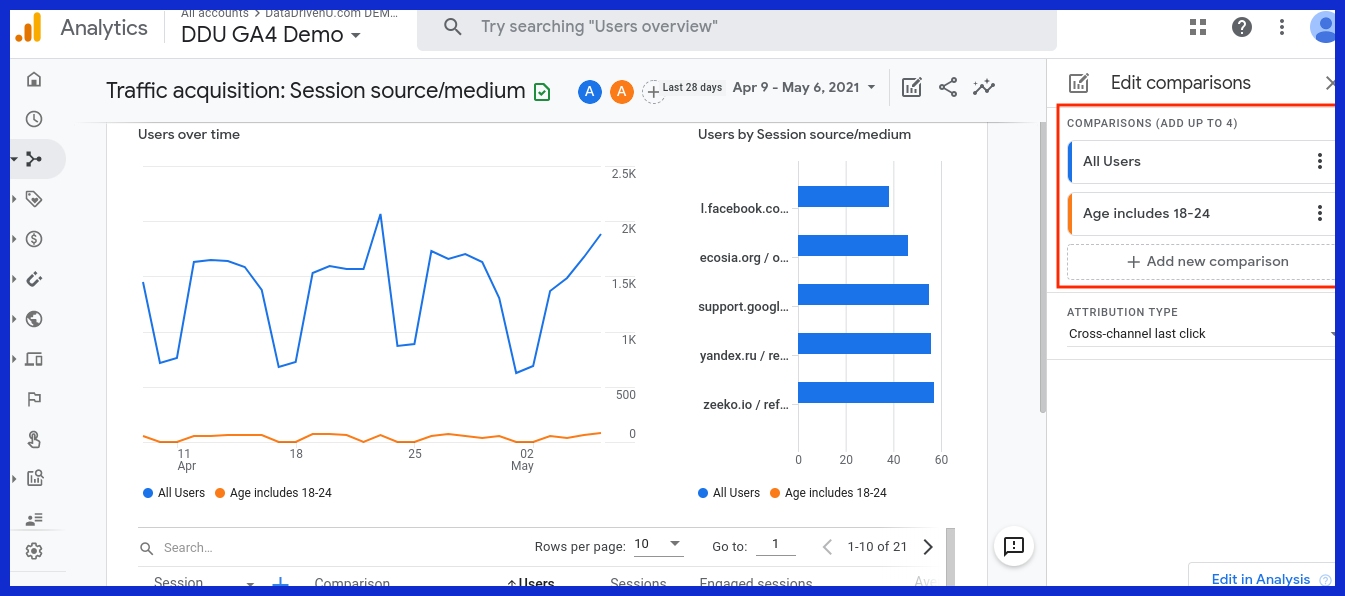
- Traffic acquisition reports
- Trend reports
Departments can use dashboards as an effective reporting analytics tool to easily track their results, compare them against their goals, and inform the next steps to take, presenting data in a visually compelling way with a real-time feed and data insights.
When Reporting Falls Short
These reports often fail to address the causes of shifting trends or what steps to take moving forward. Without deeper analysis, those numbers alone can risk missing the full story.
Operating off of outdated, static reports does not give the whole picture and leaves critical questions unanswered. That’s where analytics comes in to uncover the story underneath.
What is Business Analytics?

Business analytics is the process of using data to understand what’s happening in a business and make smarter decisions. It goes beyond just reporting numbers—it looks deeper to explain why things are happening and what might happen next.
While reporting shows what has already occurred, analytics helps answer bigger questions like:
- Why did it happen?
- What will happen if trends continue?
- What should we do about it?
Analytics uses tools like statistics, mathematics, and advanced software to turn data into clear, helpful insights.
There are four main types of business analytics:
-
Descriptive
-
Diagnostic
-
Predictive
-
Prescriptive
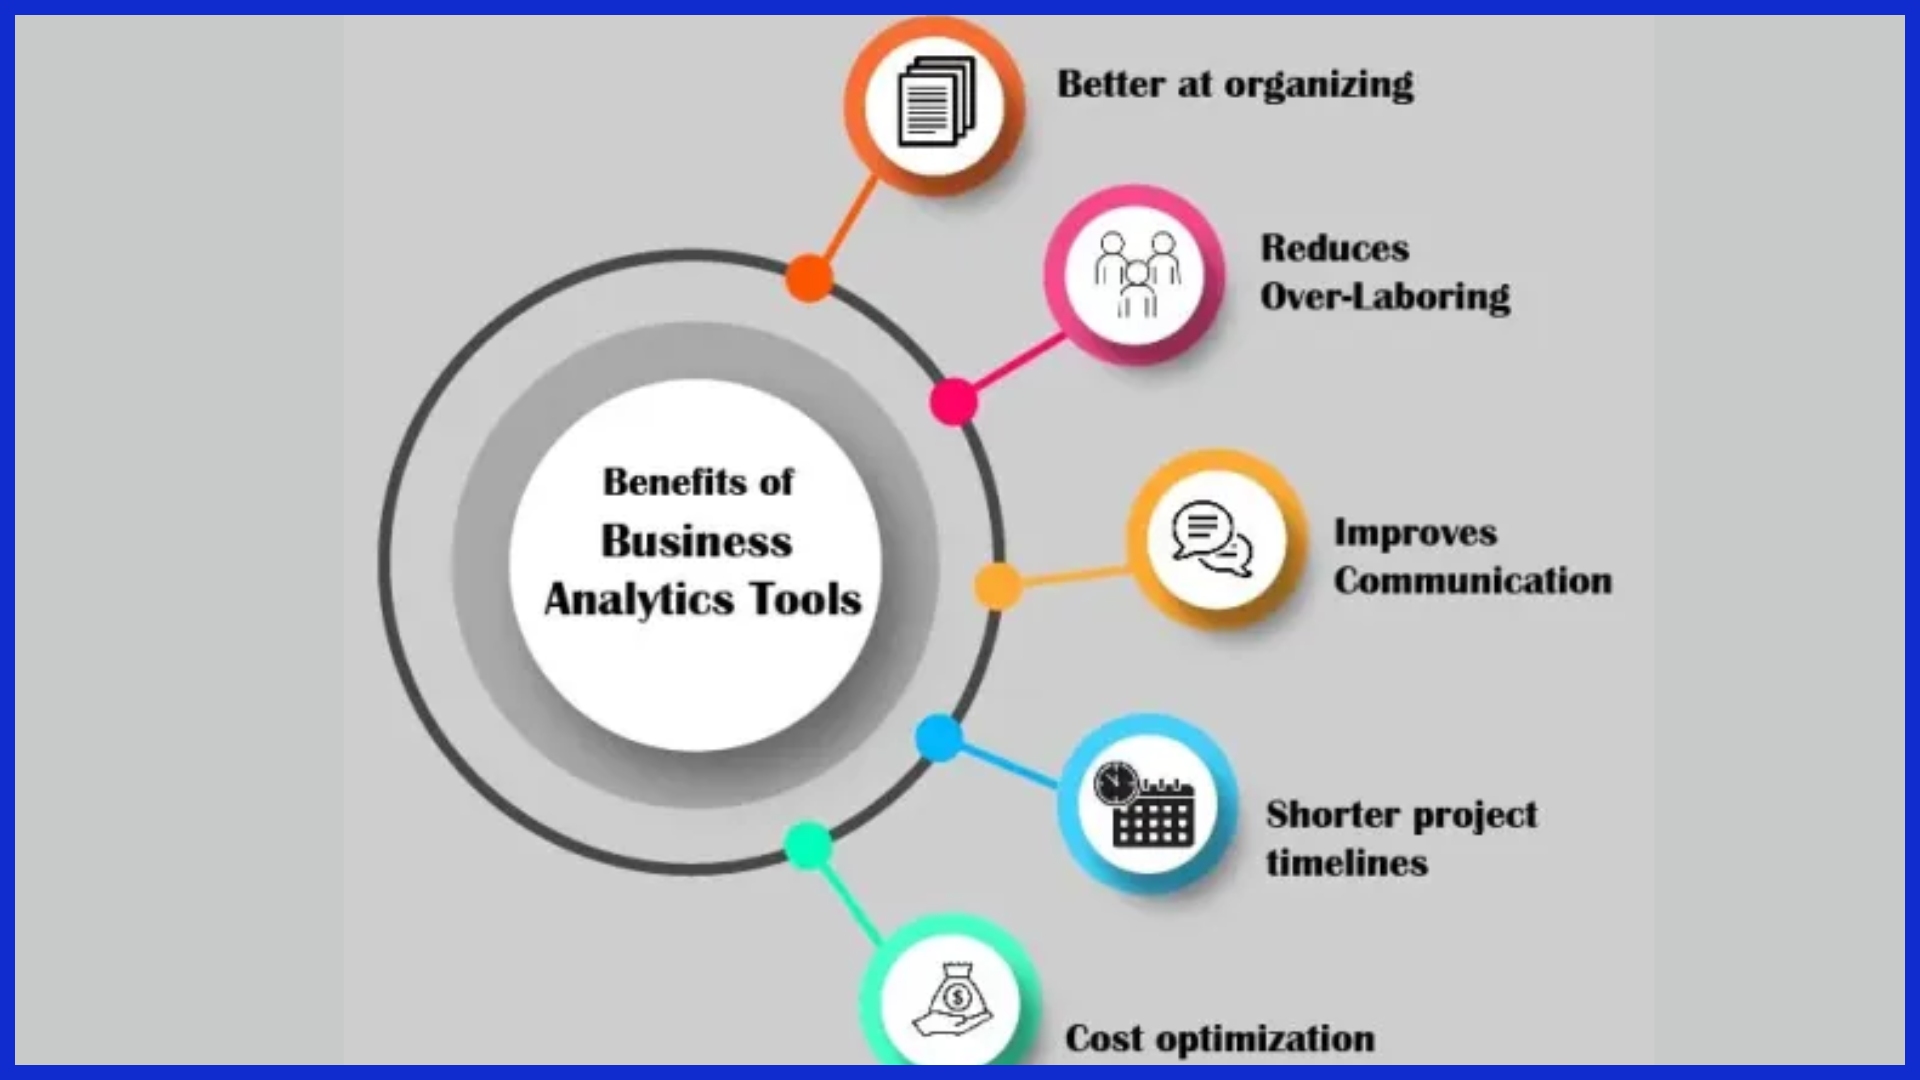
Analytics helps business leaders make informed, practical choices. It can measure how efficient operations are, highlight areas that need improvement, and reduce waste or extra costs. From marketing to customer service, every team can use analytics to uncover growth opportunities and make better decisions.
With tools like data mining, predictive models, and visual dashboards, it’s easier than ever to turn data into action.
The Power of Analytics
With analytics tools, teams can make decisions based on data and evidence, not hope. Effective reporting identifies unexplored avenues for growth, assists in predicting future trends, and provides a data-driven competitive advantage in an increasingly saturated market.
Key Analytics Approaches
|
Approach |
What It Does |
Key Method |
When to Use |
|---|---|---|---|
|
Descriptive |
Shows what happened |
Reporting, charts |
Review past performance |
|
Diagnostic |
Explains why |
Root cause tools |
Address drops or spikes |
|
Predictive |
Forecasts future |
Modeling |
Plan for trends |
|
Prescriptive |
Suggests actions |
Simulations |
Decide what to do next |
Choose the best approach for your specific business problem using effective reporting analytics tools.
Analytics: The “Why” Uncovered
Analytics is what gets us closer to understanding why something has shifted, like why last month’s sales were suddenly higher than normal. Understanding how to identify “cause” versus “merely an association” is critical.
Having clear answers to these hard questions provides the necessary confidence that leaders need to take decisive action.
What are Business Insights?
Business insights are the “aha!” moments that come from digging deeper into your data, not just looking at charts or numbers, but truly understanding what they mean. These insights help companies make smarter decisions and shape a better future.
While data analytics shows you trends and patterns, business insights tell you what to do about them. They connect the dots between customer behavior, performance metrics, and market research to highlight what matters.
For example, imagine an online store notices many shoppers are leaving their carts during checkout. That’s more than a random fact—it’s a clear signal to fix that part of the process.
Insights turn information into action. They help teams spot what’s working, what needs improvement, and where to focus energy for better results.
With the help of powerful reporting tools and AI, businesses can even predict customer behavior, like what products people might want next, giving them a competitive edge.
Bottom line? Business insights make data useful. They help you stop guessing and start making confident, informed decisions that drive success.
Defining True Insights
Authentic insights drive teams to immediate action. They don’t stop at simply reporting, “Sales fell off last month,” but rather explore the reasons behind it. An observation merely tells you what you need to know; an insight tells you how to apply that knowledge.
To be actionable, insights must align with business objectives. That usually requires sales, marketing, and product teams to work together. It takes both of them working together to understand the complete picture and come to a consensus on what’s most important.
Insights: Your Action Catalyst
Insights are your catalyst for action. They assist companies in fine-tuning their marketing, devising plans for new goods, or addressing shortcomings in operations. For example, if data indicates a drop in engagement on social media, this is an important insight.
This might just inspire you to experiment with a different format. Concise, actionable insights help teams understand what needs the most attention. Yet beyond advancing the work itself, it helps communicate those stories to key stakeholders, keeping everyone aligned.
From Data to Decisions
- Collect quality, relevant data
- Analyze to spot trends or patterns
- Link findings to business goals
- Collaborate across teams
- Tell a clear story with the results
- Check insights often to keep them useful
We think that clean and timely data is pretty important! It’s essential for teams to constantly monitor whether their insights still align with the evolving business landscape.
So, effective storytelling is all about ensuring your insights reach the right people and resonate with them.
Reporting vs. Analytics vs. Insights
Reporting, analytics, and insights all serve a valuable but distinct purpose in a data-driven business. Reporting sums up past results—think weekly website visits or email open rates—without breaking down why those numbers look the way they do. Effective reporting is essential for generating comprehensive data that informs future decisions.
Analytics goes a little further down the rabbit hole. It allows you to compare data over time and look for emerging trends. For example, it reveals connections, like how an increase in traffic is connected to a recent advertising campaign, showcasing the importance of data analytics in understanding business performance.
Insights go a step further, unraveling the trends and offering actionable insights. They show you what pages need work and help you figure out what channels are producing the most qualified leads, ultimately aiding in effective marketing strategies.
Used together, these three tools offer a full picture:
- Reporting tells the story of the past.
- Analytics explains the cause.
- Insights guide your next steps.
Take Google Analytics 4 (GA4) for example:
- It reports your top-performing pages.
- Analyzes where traffic is coming from.
- Then helps you decide where to focus for better growth.
A smart data strategy uses all three to move from just seeing numbers to taking action. The report shows slow sales. Analytics reveals you lost search traffic. Insights recommend updating your SEO strategy or launching new ad campaigns.
When reporting, analytics, and insights work together, you get clarity, direction, and real results.
1. Focus: Past, Present, Future?
|
Component |
Past |
Present |
Future |
|---|---|---|---|
|
Reporting |
Strong |
Moderate |
Weak |
|
Analytics |
Moderate |
Strong |
Moderate |
|
Insights |
Weak |
Moderate |
Strong |
Reporting tells the story of what has passed. Analytics allows you to figure out what’s happening today. Insights inform the next steps.
Each serves a unique business purpose, and having all three in conjunction allows teams of all types to achieve their objectives.
2. Question: What, Why, What Next?

Reporting answers the question of what happened. Analytics helps answer the question of why it happened. Insights provide direction for what to do next.
Asking these questions allows teams to identify issues, determine where they need to make repairs, and outline what their next steps should be. Teams get the greatest benefit by collaborating with others to answer these questions.
3. Output: Summary, Patterns, Strategy
- Reporting: daily sales reports, site traffic summaries
- Analytics: trend graphs, conversion patterns, channel breakdowns
- Insights: strategy shifts, campaign tweaks, new content plans
Specifically, each output is valuable in distinct ways. From reporting analytics to data insights, the integration of analytics tools has become an umbrella term.
4. Skills: Technical, Analytical, Strategic
Reporting requires tool-oriented skills, as seen with GA4, especially when using a reporting analytics tool. Analytics involves identifying trends through data analysis, while valuable insights necessitate strategic, big-picture thinking to translate findings into actionable next steps.
5. Impact: Monitor, Optimize, Innovate
All three play a critical role in tracking, shaping, and growing a business. Reporting is an important starting point. Analytics optimizes your progress.
Insights lead to innovation and intelligent adaptation.
Build Your Data Powerhouse
A data powerhouse is an organization that has mastered the ability to leverage data to inform smarter decisions daily. It’s more than just collecting statistics. It’s about fostering a workplace culture where each individual, whether they are the CEO or an intern, values and relies on data.
Assembling this sort of architecture in the U.S. requires bringing everyone along. It takes applying the right tools, and it takes making sure that your leadership supports it 110 percent. Tools such as dashboards and AI-powered platforms enable teams to more easily track, share, and act on real-time numbers.
It’s the folks that operate the system that make those billion moves into smart moves.
The Data Value Journey
|
Stage |
What Happens |
Why It Matters |
|---|---|---|
|
Data Collection |
Gather raw facts from many sources |
Lays the base for all later work |
|
Data Organization |
Sort and clean up data |
Makes data usable and saves hours |
|
Reporting |
Turn data into clear visuals |
Helps folks see trends and key metrics fast |
|
Analytics |
Dig deeper, ask questions |
Finds patterns and answers bigger questions |
|
Insights |
Pull out conclusions and next steps |
Drives action and business growth |
Each stage lays the groundwork for the next. Cutting corners or allowing data to idle in disarray adds time and cost to the process.
Maintain an ongoing workflow of inspection and adjustment of your pipeline. Ensure each step is aligned with your strategic business objectives.
Structure Your Data Teams
Having the right talent in place is crucial. A robust team is balanced in reporting, analytics, and insight generation work. On one side, data analysts are the ones who identify patterns.
That’s something marketers understand all too well when running campaigns. An engaged executive team makes sure they’re pointing the team in the right direction. Defining clear roles and responsibilities can prevent confusion and misalignment down the line.
Continue to learn collectively—new tools are emerging every day. Regular cross-team chats and shared dashboards across teams can help break down silos and get your data team moving in unison.
Leverage AI and ML
AI and ML supercharge the speed and depth with which you can dive into your data. They absorb the tedious, mundane tasks, identify trends that humans wouldn’t notice, and provide recommendations to inform your future actions.
By making smart investments in these technologies, we can unlock a path toward quicker, more intelligent dispatching of emergency calls.
Transform Data into Action
Transforming raw data into actions that fuel business growth requires a well-defined and consistent approach. The true power of data lies in going beyond the display of figures in a PDF. It’s about transforming those digits into a narrative by identifying trends and determining which actions should come next.
Teams that work together and share what they know improve their capacity to identify trends. This methodology additionally aids in linking findings directly to organizational objectives. Good data work begins with a rigorous process—defining the problem, seeking out alternatives, and reaching evidence-based conclusions.
Communicating what you’ve found using plain language is essential when building support among stakeholders.
Generate Actionable Insights Now
- Begin with what will be most useful and impactful to your team and organization.
- Establish processes to gather high-quality, expert data from known, reputable sources.
- Leverage emerging technologies, such as artificial intelligence, to integrate disparate data sources and identify trends.
- Conduct regular team meetings to disseminate learnings and pose new inquiries.
- Ensure every insight connects to an actionable business objective.
Accurate, timely, and meaningful data allows reports to tell the truth, be helpful, and provide value. An organization that provides space for experimentation and failure will be able to translate data into more strategic decisions quickly.
With timely insights, teams are better equipped to stay one step ahead of the market and pivot quickly when the tide changes.
Frameworks for Insight Success
Some popular frameworks, such as the problem-solution-conclusion structure, keep teams focused and productive. This framework allows teams to understand what they should be searching for and what actions they should take.
Feedback loops, in which teams review, discuss, and revise the insights, ensure that decisions remain sharply focused. Flexibility is important as well, given that the needs of the business may shift rapidly.
Measure Your Data’s Impact
Measuring the impact of data is essential. Choose actionable KPIs, such as conversion rates or customer acquisition, so that you can easily determine what’s working.
Measure outcomes regularly and share them transparently with your internal team. Sharing builds trust with the public and other stakeholders and helps to maintain momentum behind the effort.
Conclusion
To derive the maximum benefit from data, it’s important to understand what each stage brings. Reporting reports display what was done, end of story. Analytics goes deeper and explains what caused it to happen, illuminating the story that’s hiding in the data. Insights is what takes all that hard work and data and turns it into something actionable.
Agencies and teams that integrate all three can identify opportunities, identify threats and hazards, mitigate them, and accelerate in real time. Consider an example of a small business that records its transactions. An analytical report that identifies trends in the data, such as low sales on Saturdays. Analytics identifies that weekends perform better.
Want to take your process to the next level? Visit KPI.me to find the tools that help you keep all of your data clean, simple, digestible, and shareable.
Frequently Asked Questions
What is the main difference between reporting, analytics, and insights?
Reporting simply tells you what happened, while reporting analytics reveals why it happened. Valuable insights are the last mile, guiding you on what to do next. Each stage serves as a stepping stone to making smarter, data-driven business decisions through effective reporting.
Why is business reporting important?
Business reporting, enhanced by effective reporting analytics tools, provides timely, high-quality, and relevant real-time information. It allows you to monitor your business’s overall health and identify emerging patterns, enabling valuable insights for strategic planning.
How does business analytics add value?
Analytics takes a much deeper look into your data, utilizing reporting analytics to discover trends and underlying reasons. This approach allows you to uncover valuable insights, identify and address problems, and better map out your next steps.
What makes an insight actionable?
An actionable insight is concise, applicable, and points to a concrete business decision through effective reporting. In short, it should help you utilize data analytics to make informed decisions and ultimately drive business success.
Can small businesses benefit from analytics and insights?
Yes. Can small businesses in Los Angeles benefit from data analytics and valuable insights? They allow you to get to know your customers more, target your marketing better, and increase your bottom line.
How do I start building a data powerhouse?
It all begins with having good, trustworthy data for effective reporting. Leverage local analytics tools and dashboards to compile it and equip your staff to analyze and respond to the data.
Why should I turn data into action?
Turning data into action through effective reporting analytics allows you to get out ahead of your competitors. This enables you to react faster to shifting consumer demands and seize new opportunities for business success.