
What are Some Free Tools for Sales Reports
Key Takeaways
-
Sales reports are essential instruments that capture, interpret, and convey sales outcomes, assisting teams and stakeholders in remaining coordinated with organizational objectives.
-
Good sales reports incorporate important baselines, sales funnel analysis, time-based comparisons, and product-level analysis.
-
Daily, weekly, monthly, quarterly, and annual reporting provides timely insights, facilitates strategic adjustments, and gives both short and long term perspectives.
-
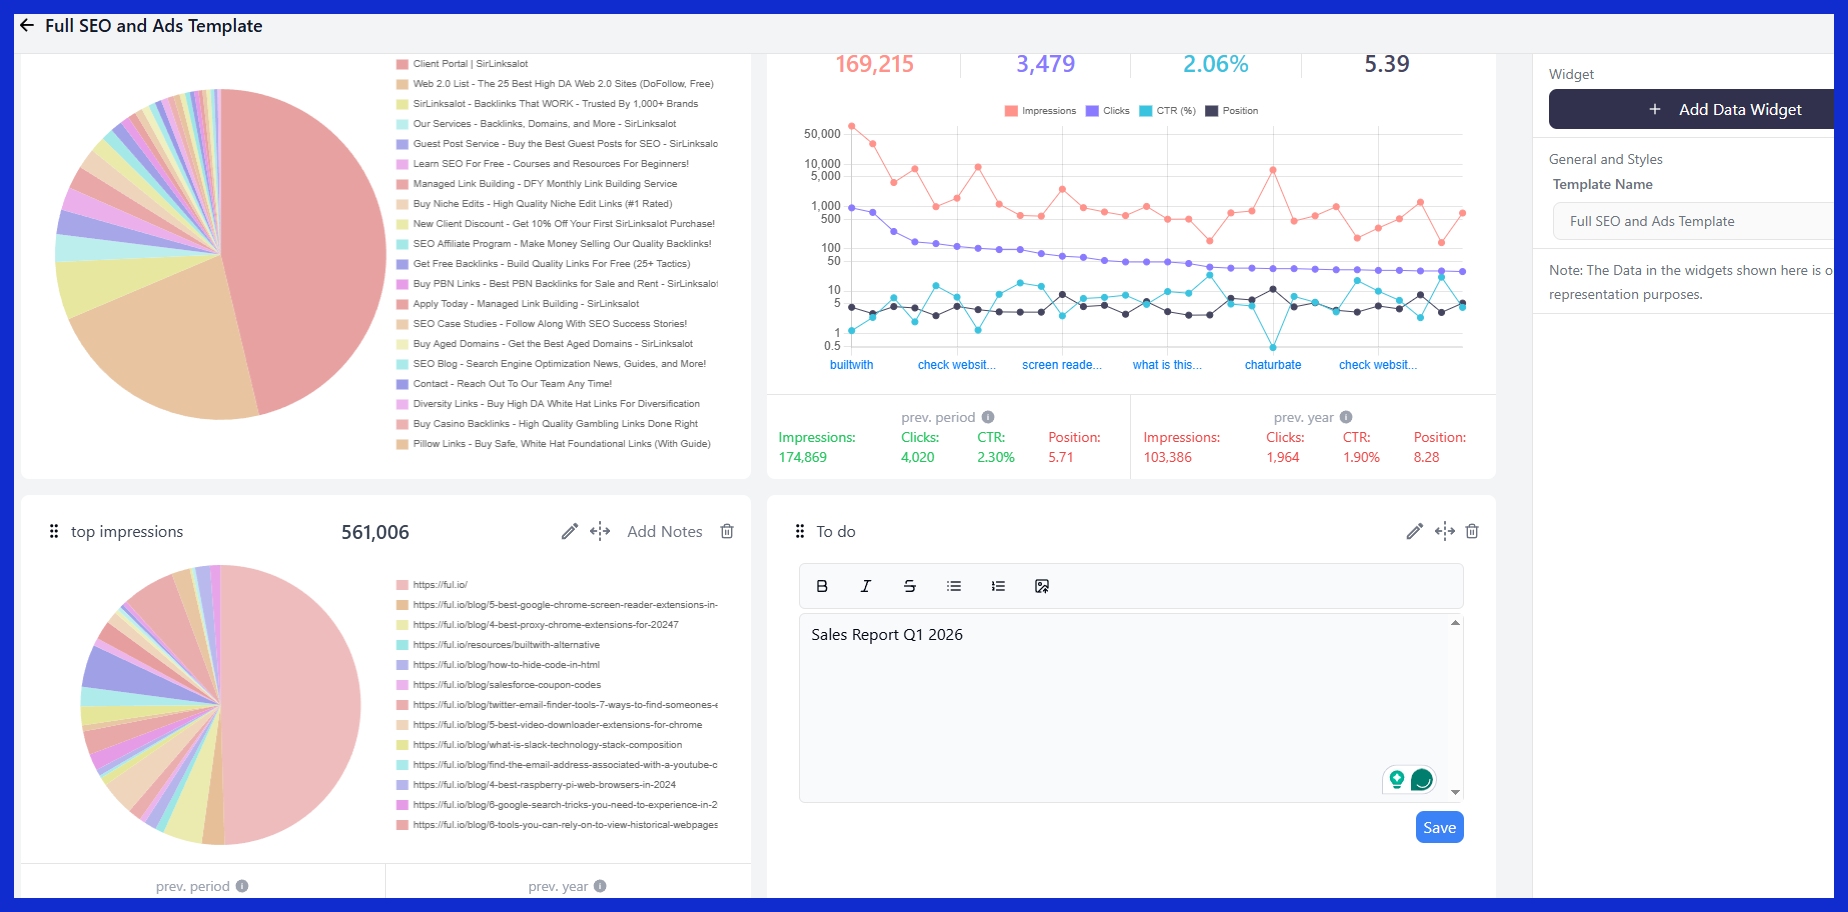
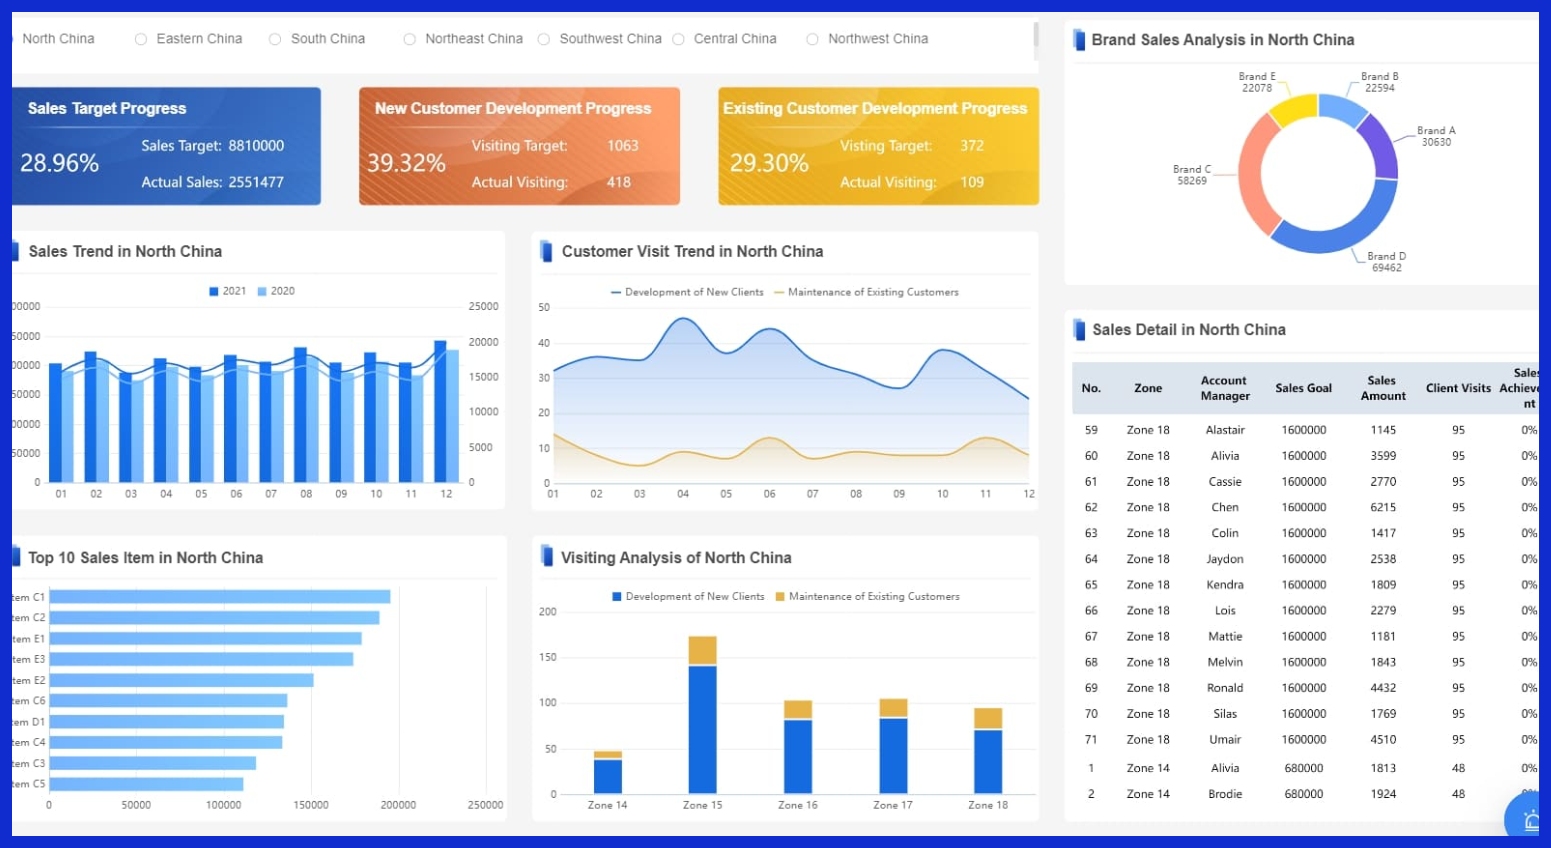
Adding visuals such as charts and graphs to sales reports helps bring data to life, engage the reader, and make complex information easier to comprehend.
-
By automating sales reports, your team can be more efficient and less error-prone, with insights getting into decision-makers’ hands as soon as they’re available.
-
Peering past the pure figures to find trends and predictive insights gives businesses the ability to act in advance and position sales in the context of larger organizational goals.
Sales reports are snapshots that reveal important truths about sales efforts over a specific period. These reports typically track figures such as total deals, revenue, and trends.
Most teams use sales reports to inform decision making, identify opportunities, and strategize growth. Easy tables and charts illustrate daily, weekly, or monthly sales.
Transparent sales reports keep teams aware of what’s working well and what must change. The next section will share common types and tips to build these reports.
The Purpose of Sales Reports
Sales reports are critical instruments for monitoring and understanding sales performance within defined time periods. They take raw sales data and transform it into a transparent view of a team or company’s performance. Most companies generate such reports daily, weekly, or through a monthly sales report, depending on their particular needs and the frequency with which they have to take action.
These reports answer the basic questions: What did we sell? Did we make our targets? The figures in such reports are not mere decoration; they assist sales managers and teams in figuring out where things are working and where they aren’t. By leveraging sales metrics, sales reports expose patterns that inform business decisions and strategies.
For instance, displaying data over time can highlight a decrease in customer renewal for a particular product or an increasing trend of sales in a new geographic region. If a monthly report reveals a slump in contract renewals for a service, managers can investigate, search for reasons, and shift their approach to improve overall sales growth.
Key Components of Sales Reports
A strong sales report provides insight into business growth, sales team performance, and market demand. By deconstructing it into core components, teams can identify holes more quickly, make more informed decisions, and keep everyone aligned. When built well, a comprehensive sales report should include sales metrics.
-
Performance metrics and KPIs
-
Sales funnel analysis
-
Defined reporting time periods
-
Product-level data
-
Team performance snapshots
-
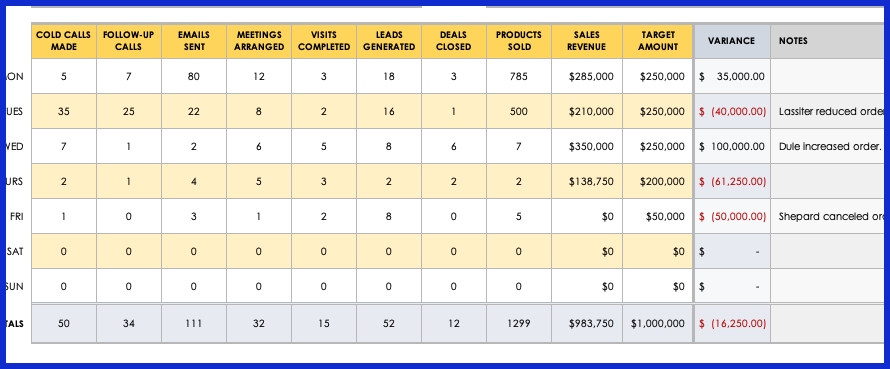
Sales activity indicators (calls, meetings, prospecting time)
-
Data visualization (charts, graphs, dashboards)
-
Qualified leads and tool effectiveness
-
Regular updates and automated data integration
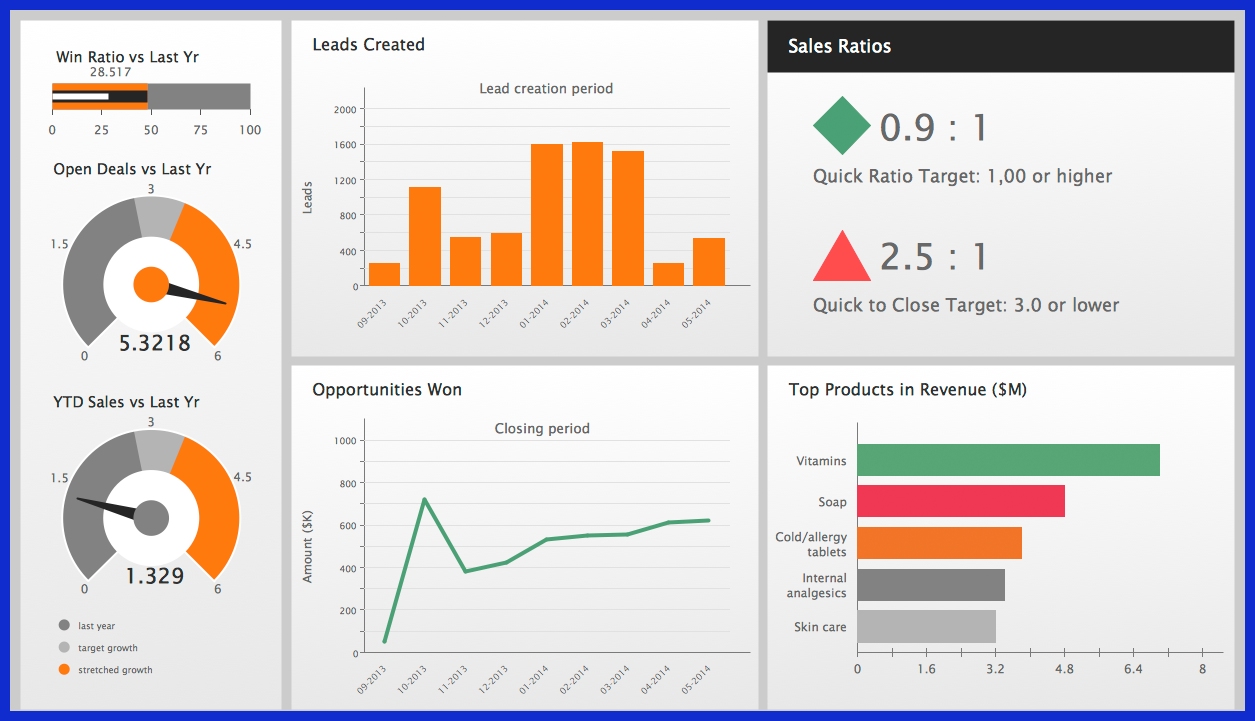
1. Performance Metrics
KPIs are the soul of any good sales report. These could include sales revenue, deal size, win rates or sales cycle length. When compared across months, these numbers illuminate growth trends or dips that require further examination.
A sudden decline in win rates could indicate problems in lead quality or sales approach. Reports should segment for team and reps. This type of granularity assists managers in providing feedback where it’s most needed and identifying top performers to reward or emulate.
Metrics are equally key for setting sales goals that actually align to real-world market changes, not wishful thinking!
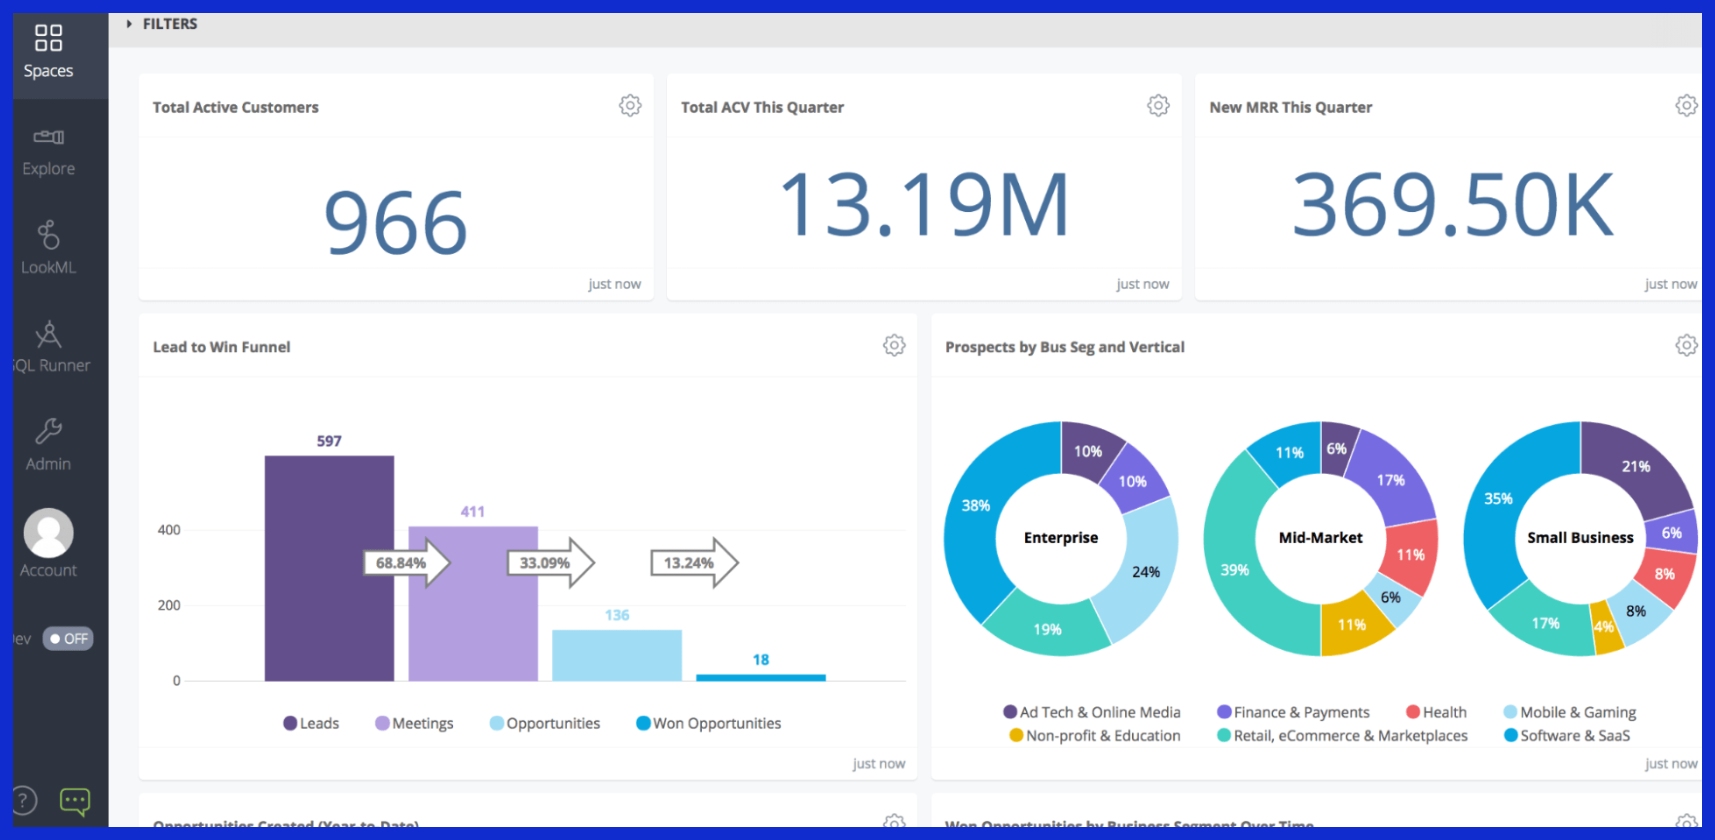
2. Sales Funnel
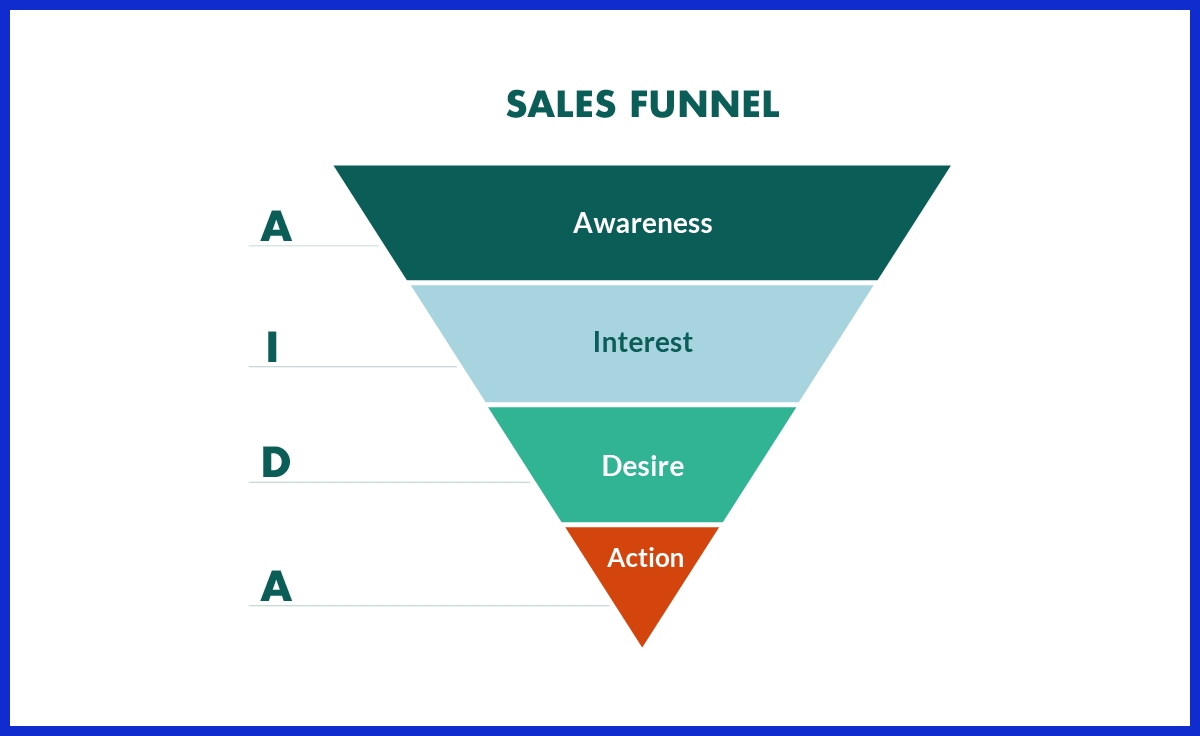
Sales funnel tracking provides a high-level perspective of the lead flow from initial contact to deal closure, contributing to effective sales reporting. Each step, from awareness to decision, can be mapped and measured using sales metrics. By examining conversion rates at each step, it is simple to identify where the majority of leads fall off, such as from demo to proposal.
Funnel data allows teams to optimize their sales process and improve their sales performance. For example, if a lot of leads are getting ‘stuck’ in the evaluation stage, it may be time to rethink your product demonstrations or provide additional assistance.
Regular funnel health checks keep focus on work that brings the most value, ensuring that the sales team is aligned with sales goals and maximizing their sales growth potential.
3. Time Periods
A good sales report establishes its time frame—day, week, or month—so the results have meaning. By working with defined periods, your team can monitor progress, identify seasonality, and resource needs more effectively.
Reports can be scaled to sales volume. For instance, a high-touch SaaS team will want weekly updates, while others may only require monthly summary reports. Adhering to a reporting calendar guarantees that teams receive insights when they are needed and not too late to do something about it.
4. Product Data
Product-level sales data lets teams know which items are hot and which aren’t. Breaking it down by region or category can show you how customer preferences vary between markets. A new product launch is propelling growth in Asia but is not doing well in Europe.
These insights feed into marketing plans, inventory checks and where to invest additional support. Following products over time can indicate whether a new campaign or sales push is effective, or if adjustments should be made.
5. Team Performance
Tracking team and rep-level performance is at the heart of keeping people motivated and accountable. Reports should capture outcomes, such as sales closed, as well as activities, like calls and meetings. Historical benchmarks provide context and assist in setting reasonable expectations for all parties.
This data-sharing creates a healthy dose of competition and helps leaders identify who needs support or training. Feedback and coaching become more specific, and that drives team growth and results.
Types of Sales Reports
There are different types of sales reports, each with its own objective. They allow businesses to monitor sales activities, identify trends and make informed decisions. Reports can be on results—revenue, new contracts, or more process oriented, like how many leads were called this week.
Various timeframes offer varying perspectives, ranging from daily reports to yearly analyses. They can indicate the performance of a product, geographic region, or team. Below is a table that sums up the main types:
|
Report Type |
Purpose |
Key Metrics |
Typical Audience |
|---|---|---|---|
|
Daily |
Quick status, spot issues |
Sales volume, lead calls |
Sales teams |
|
Weekly |
Track progress, adjust tactics |
Deals closed, progress |
Managers, teams |
|
Monthly |
Assess strategies, plan ahead |
Revenue, conversion rates |
Leaders, departments |
|
Quarterly |
Review long-term trends, big picture |
Market share, deal value |
Executives |
|
Annual |
Summarize, set future goals |
Total sales, top products |
All stakeholders |
Daily
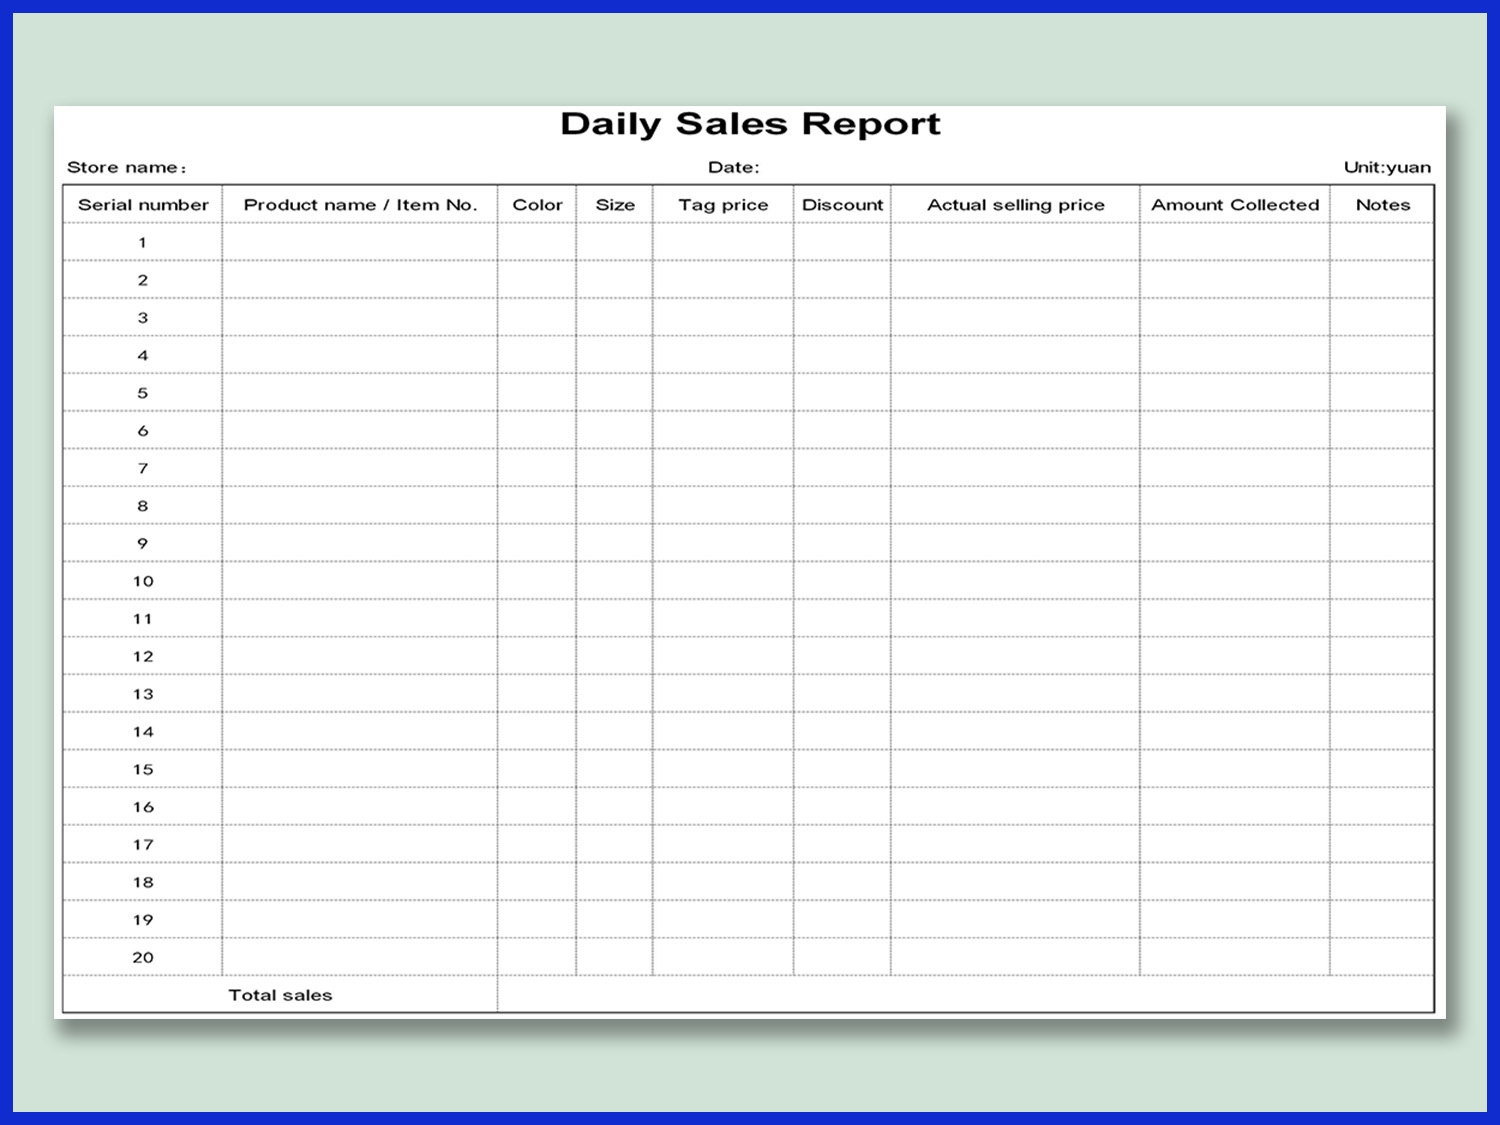
Daily sales reports record what occurred in sales on a daily basis. They display figures from real-time activities, such as calls made, offers closed, or units sold. These reports assist sales teams in identifying problems quickly, such as an unexpected decline in sales for a specific product or region.
By disseminating daily, everyone in the team is on the same page and knows what to keep an eye on. Sales managers can use these reports to verify if someone requires assistance or if there’s a quick victory they can provide to the team.
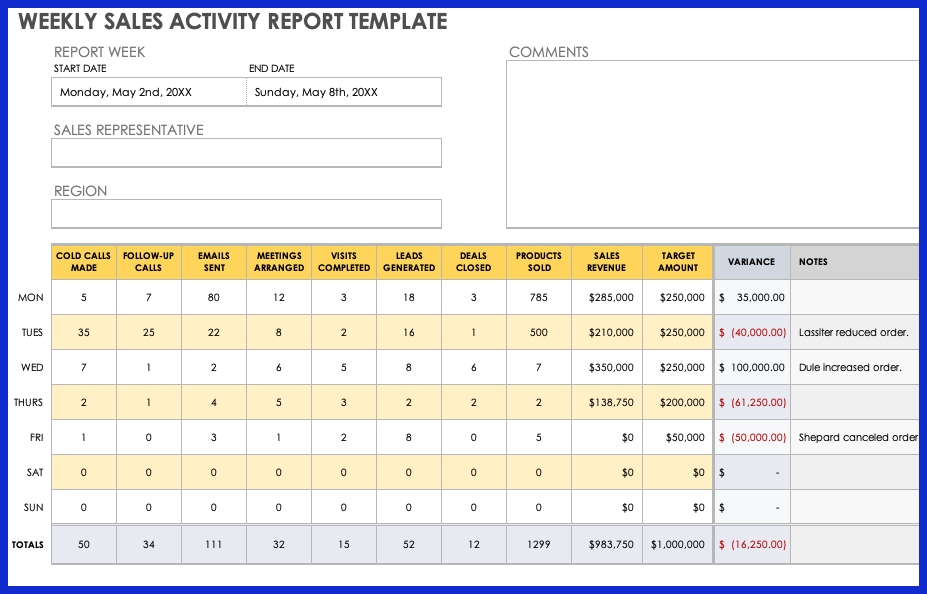
Weekly
Weekly sales reports provide a brief overview of how the team or territory has performed in the last week. They reveal what products moved, who crushed their goals and where opportunities were missed. Other teams use weekly reports to stage short meetings, sample progress and make minor adjustments to their plans.
These reports simplify pattern identification, such as if sales drop on every Friday or if a recently launched product is becoming popular. Managers can publish these to stakeholders, so everyone is up to speed without waiting for monthly updates.
Monthly
Monthly sales reports go a bit deeper by providing a wider view of performance and trends. They allow leaders to observe whether a fresh campaign was effective, whether a product launch yielded results, or whether a region’s statistics are higher or lower than the previous month.
We send monthly reports to other departments as well, so everyone is aligned on sales targets and any adjustments needed. Visual charts emphasize shifts in key numbers, simplifying planning for what comes next or recalibrating forecasts.
Quarterly
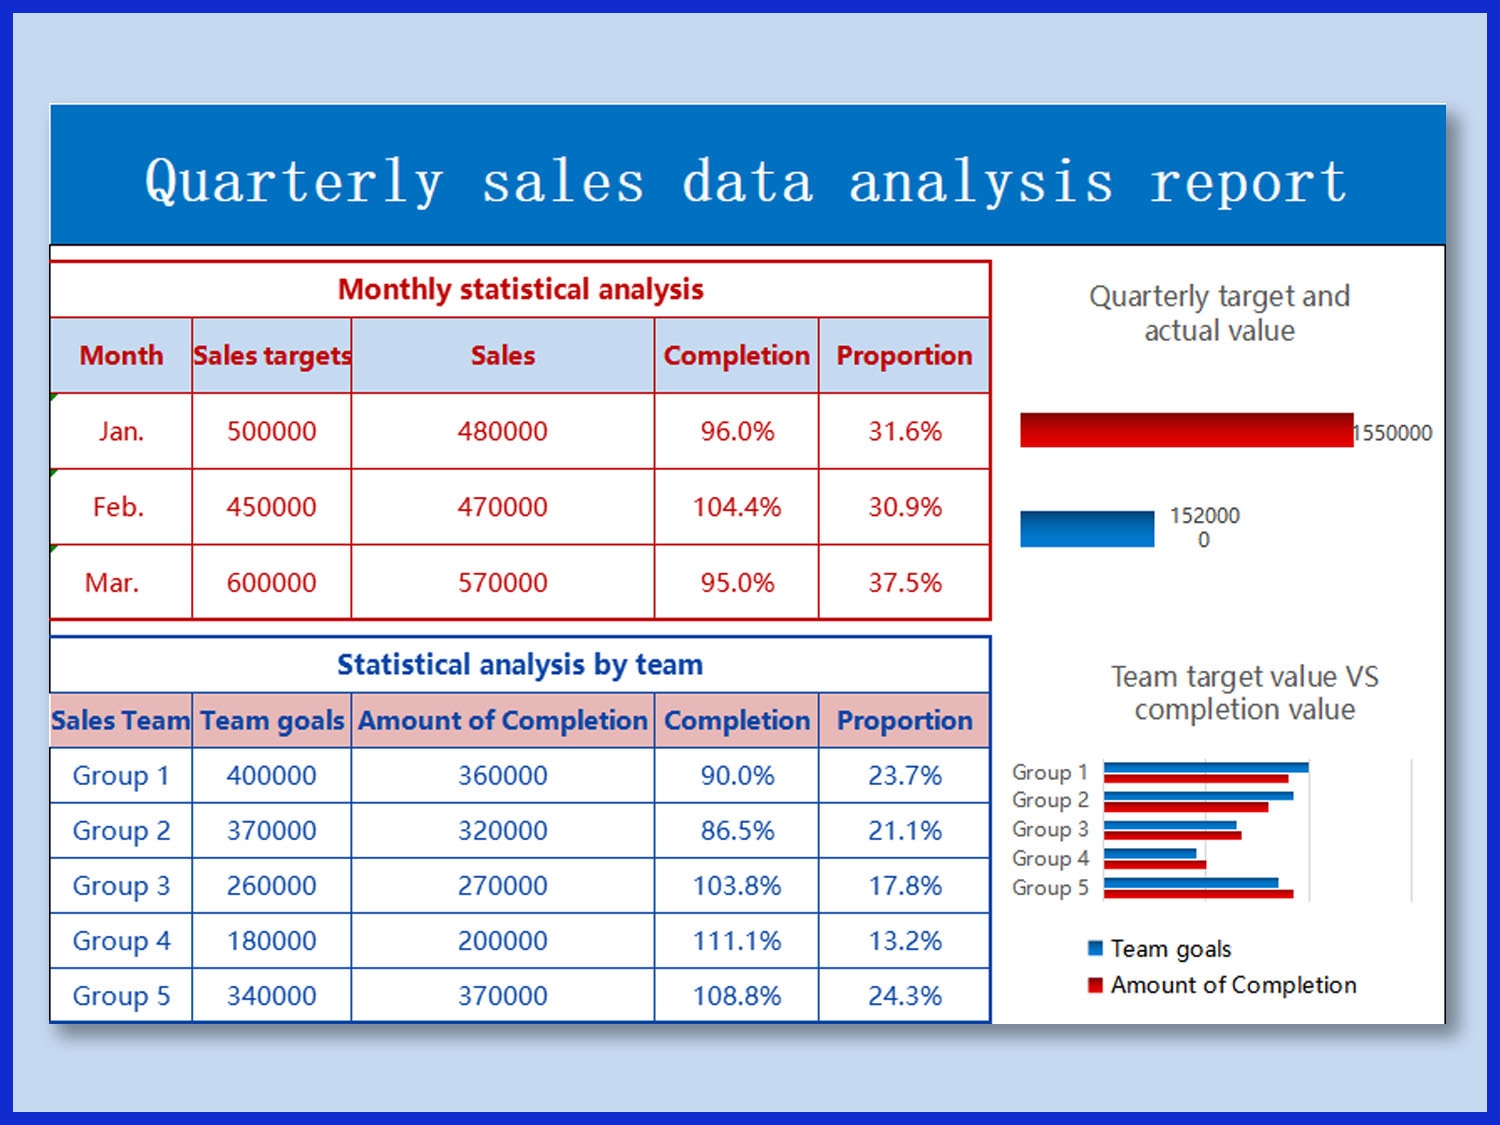
Quarterly sales reports emphasize longer-term trends and strategic objectives. These help leaders spot whether big shifts in the market or the economy are influencing sales. They typically include line of business and regional performance comparisons.
Executives glance at quarterly reports to determine where to invest resources or if a different strategy is necessary. Three-month trends can inform major decisions or identify new possibilities.
Annual
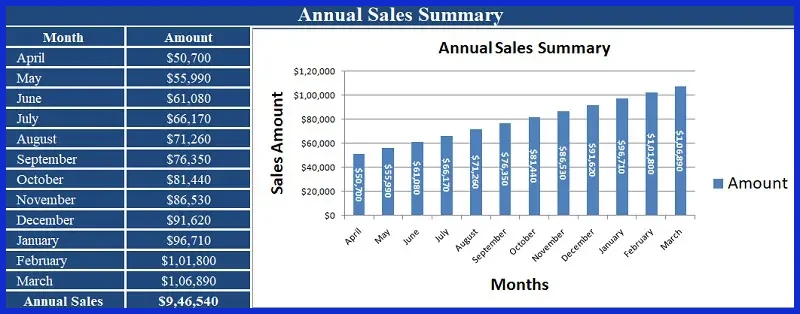
Annual sales reports compile a complete picture of the year’s events. They highlight overall revenue, best-selling products, team accomplishments, and current obstacles. Businesses employ them to find out whether their high-level plans are successful.
These reports are broadcast publicly, establishing credibility and demonstrating the status of the business. They assist in goal-setting and forward planning.
Creating Effective Sales Reports
Sales reports are not just for tracking numbers. They direct sales strategies and identify areas of action. An effective sales report is defined by its objective, the metrics selected, the presentation of the data, and the speed and precision with which it’s assembled.
Different audiences — from salespeople to upper management — often require reports at different times and with differing focuses. Having reports constructed with these needs in mind ensures teams do more than just react. They act.
Define Purpose

Each sales report needs a well-defined purpose. This defines what makes it into the report and how it’s consumed. A weekly report for a sales team might highlight pipeline health and immediate action items, whereas a quarterly report to leadership might evaluate regional revenue and contracts.
If the report is designed to identify trends or assist with coaching, emphasize those items and stay brief. Be sure the report aligns with the company’s overarching objectives. If the primary thrust is to increase contract value, concentrate on those statistics. If it’s growing leads, monitor that.
Stakeholders need to know how and why they should use the report. Include a brief statement at the beginning that sets expectations. As the business evolves, so too should the report’s objective. Check if the focus still fits every quarter or so.
Select Metrics
Selecting what metrics to display is important. Track results using outcome metrics such as revenue, deals closed, or contracts signed. Process metrics, for example, leads, calls, or meetings, provide insight into what actions generate those results.
Combining the two provides a complete view. For instance, a report may reveal that while revenue is flat, new leads are climbing, which could prove beneficial in the future. Metrics should be actionable. When someone reads the report, they should know what to do next.
Go over these selections frequently, particularly if the market changes or new objectives arise.
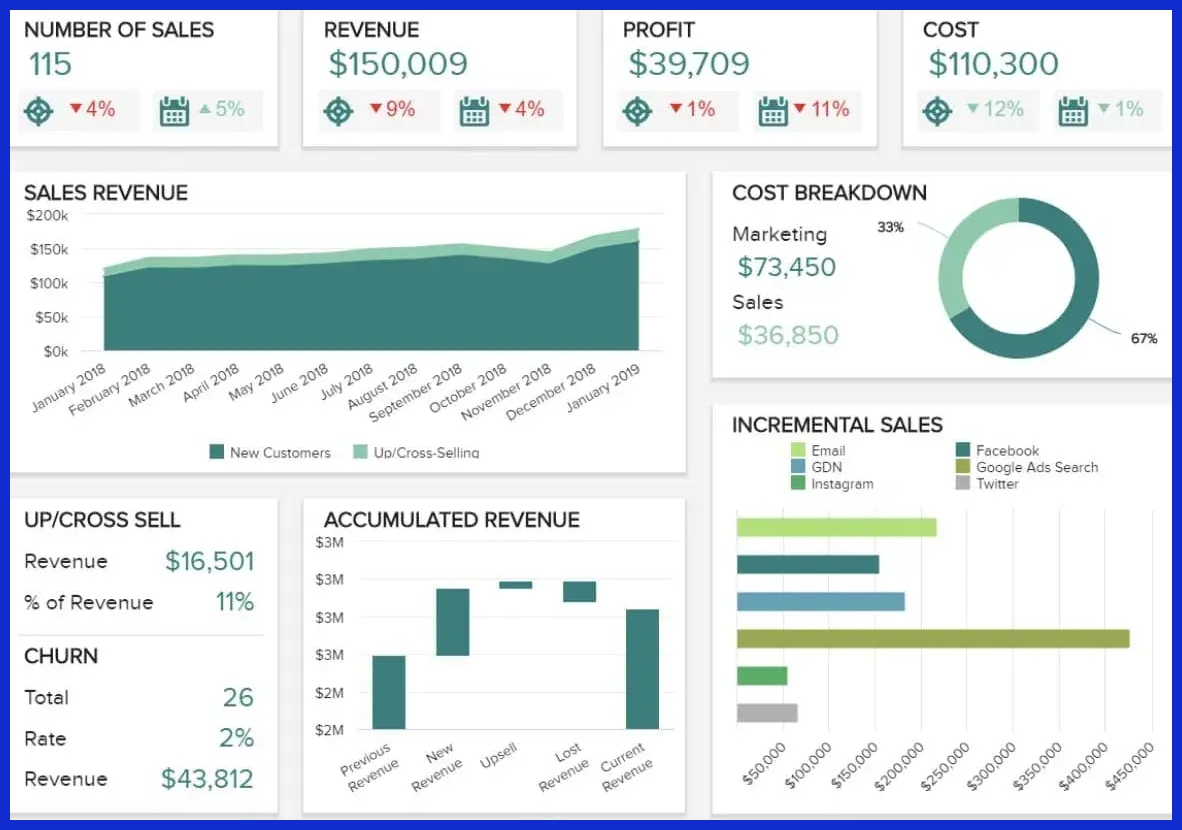
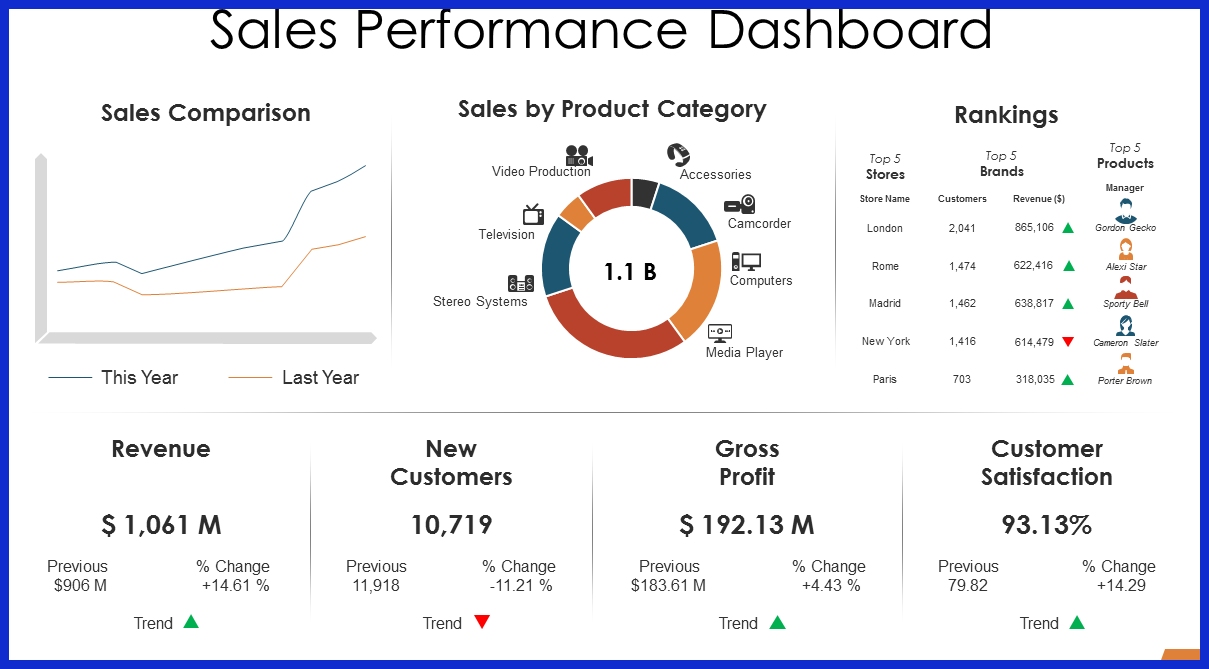
Visualize Data
Data is more digestible when it’s visual. Use line graphs to depict sales over time, bar charts for regional comparisons, or pie charts for product breakdowns. Smart visuals make it easy to identify patterns, holes, or high achievers at a glance.
Emphasize the key numbers in color or with labels. Make your graphs simple and do not clutter, so your story jumps out. Experiment with various tools or formats to identify what resonates most with your team and audience.
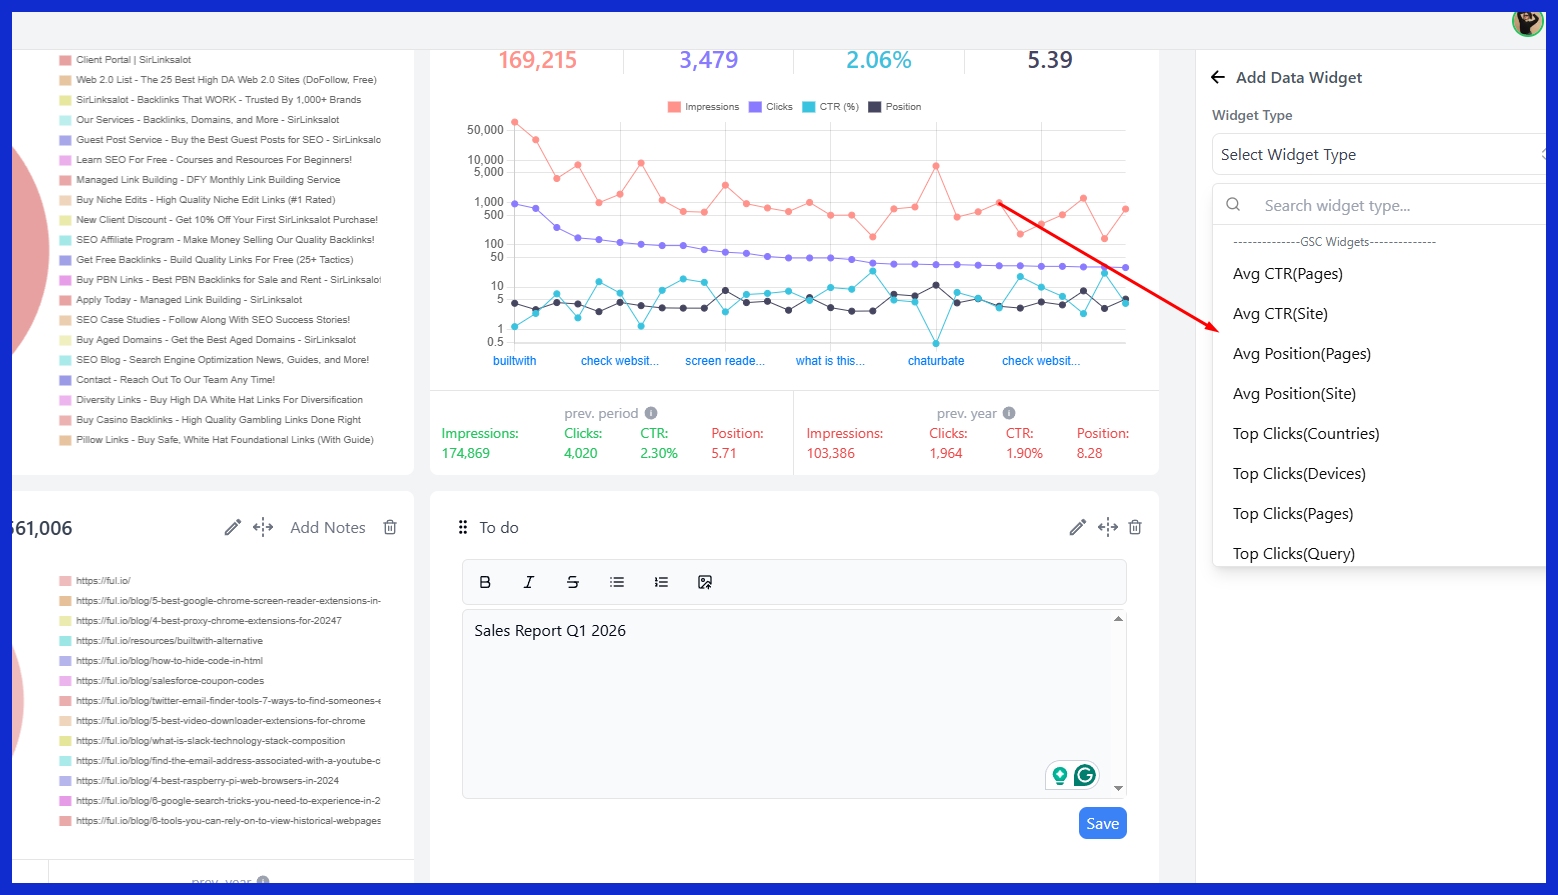
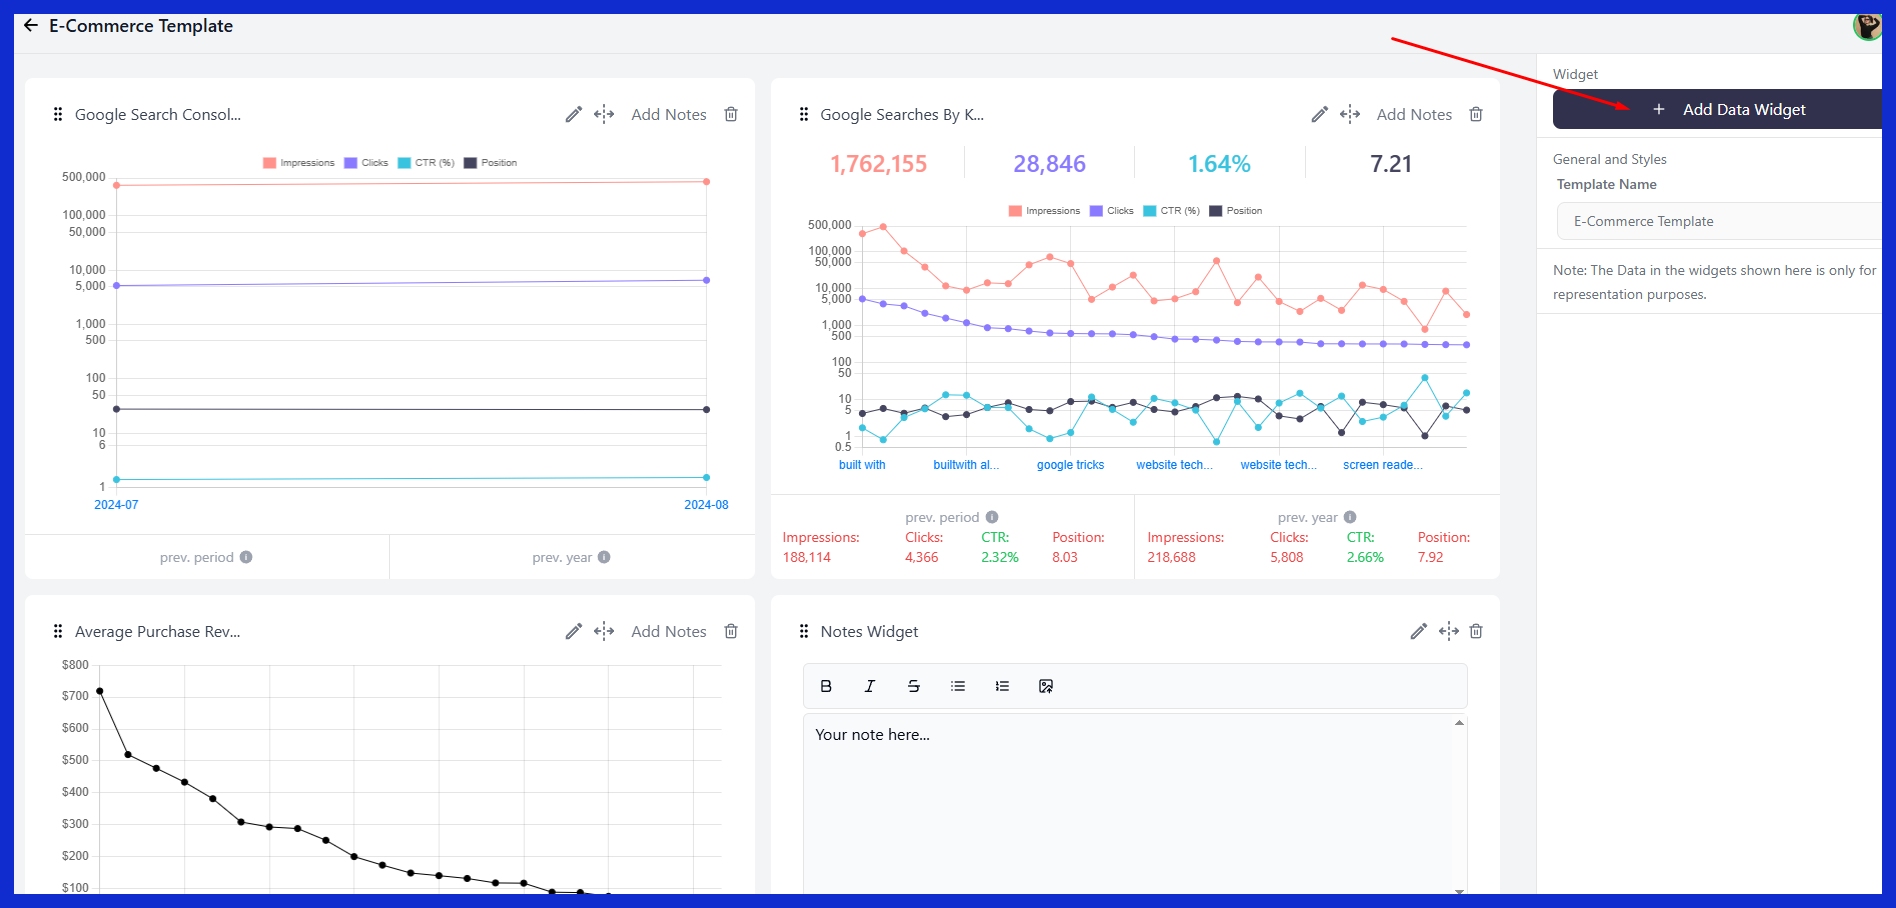
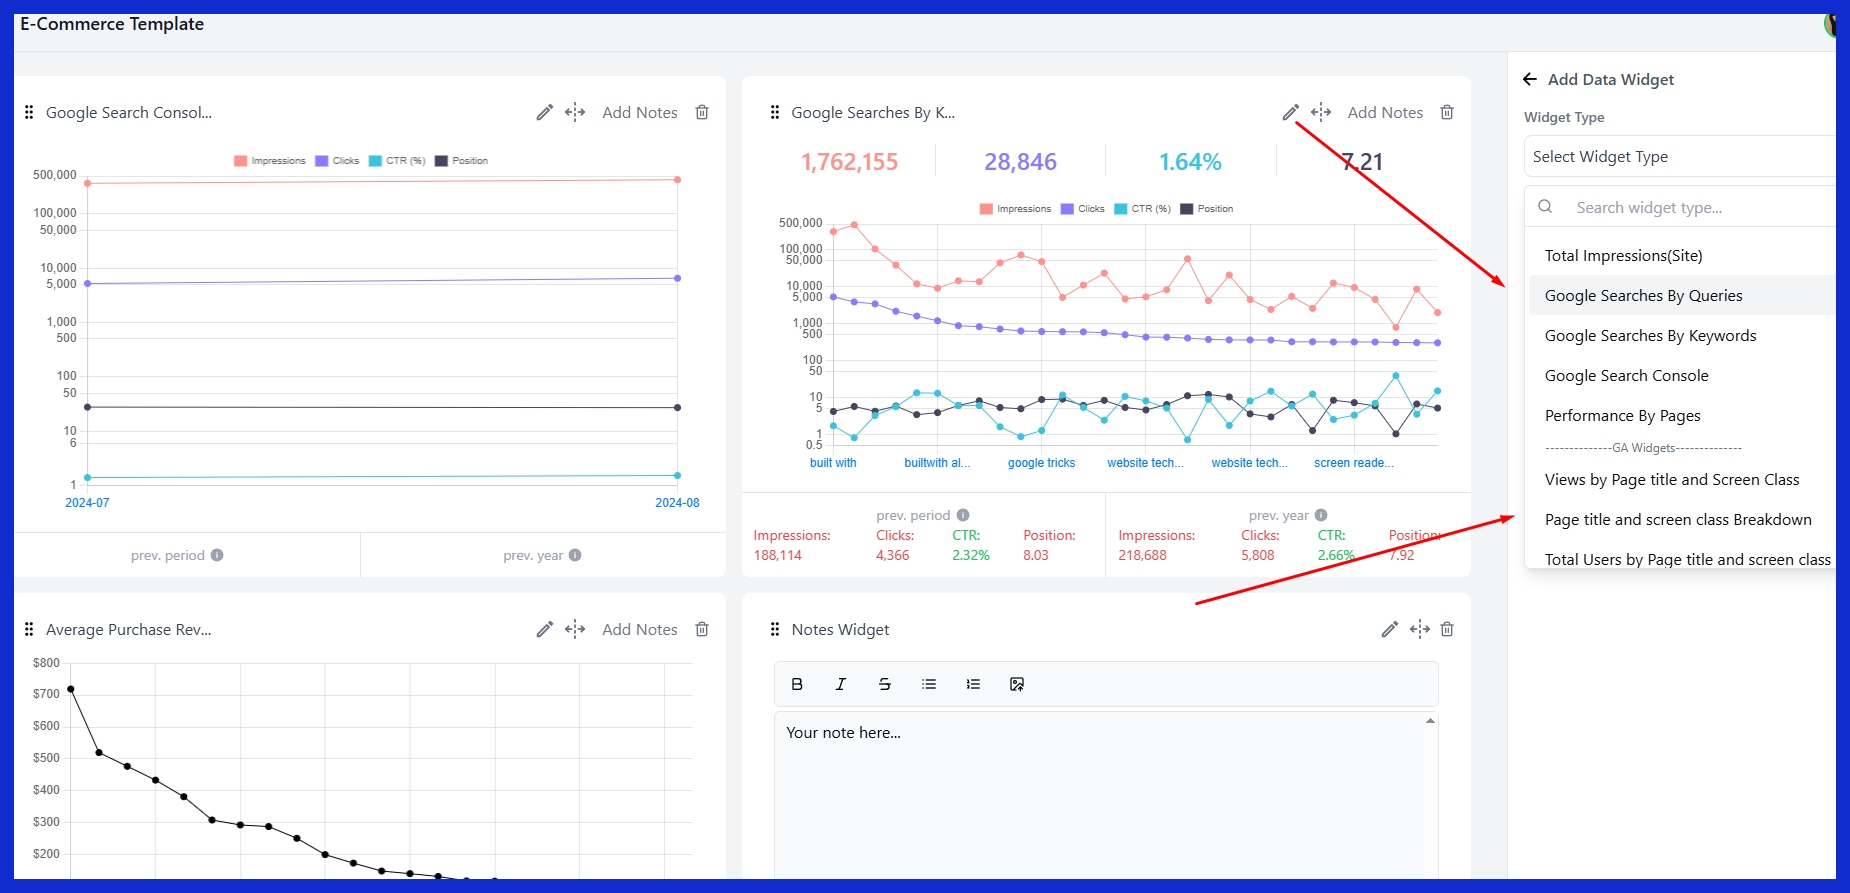
Automate Process
To save time and reduce errors, enumerate the actions required to automate your sales reports. Begin by connecting your sales data apparatus, such as CRM systems, to your report generator. This way, the majority of the figures will refresh automatically.
Schedule reports to run daily, weekly, or monthly, depending on the recipients. Automation cuts the grunt work and stops mishaps before they cascade. Watch for emerging tools that could enhance, such as AI-powered recap generation from call transcripts.
Common Reporting Pitfalls
Most sales teams encounter these same issues when constructing and distributing reports. Little stumbles in how data is gathered, tracked, or displayed can derail the entire effort and confuse decision-making. Awareness of these pitfalls can help teams address problems before they fester.
-
Do’s and Don’ts of Effective Reporting:
-
Do set a regular reporting schedule and stick to it.
-
Avoid common reporting pitfalls.
-
Don’t rely on review reports because they’re often not useful to spot trends and address problems quickly.
-
Do use reporting tools that are simple to use and update.
-
Do provide context for numbers—present both the overview and the specifics.
-
Do verify that all information is complete, current, and accurate.
-
Avoid.
-
Don’t report vanity metrics that don’t help the business advance.
-
Don’t neglect regular audits of your reports.
-
Don’t omit crucial context or background for significant figures.
-
Don’t use tools that bog you down or baffle users.
-
Don’t alter report layouts or terminology from one period to the next.
-
Data accuracy is the key. Even a slight piece of misinformation or missing data can create erroneous calls about sales trends or team performance. Double check data sources and implement checks to identify gaps or errors.
If a report misses some sales or double books the same deal, the team’s next steps could be all wrong. That’s why lots of companies use smart tools that catch mistakes early.
Conclusion
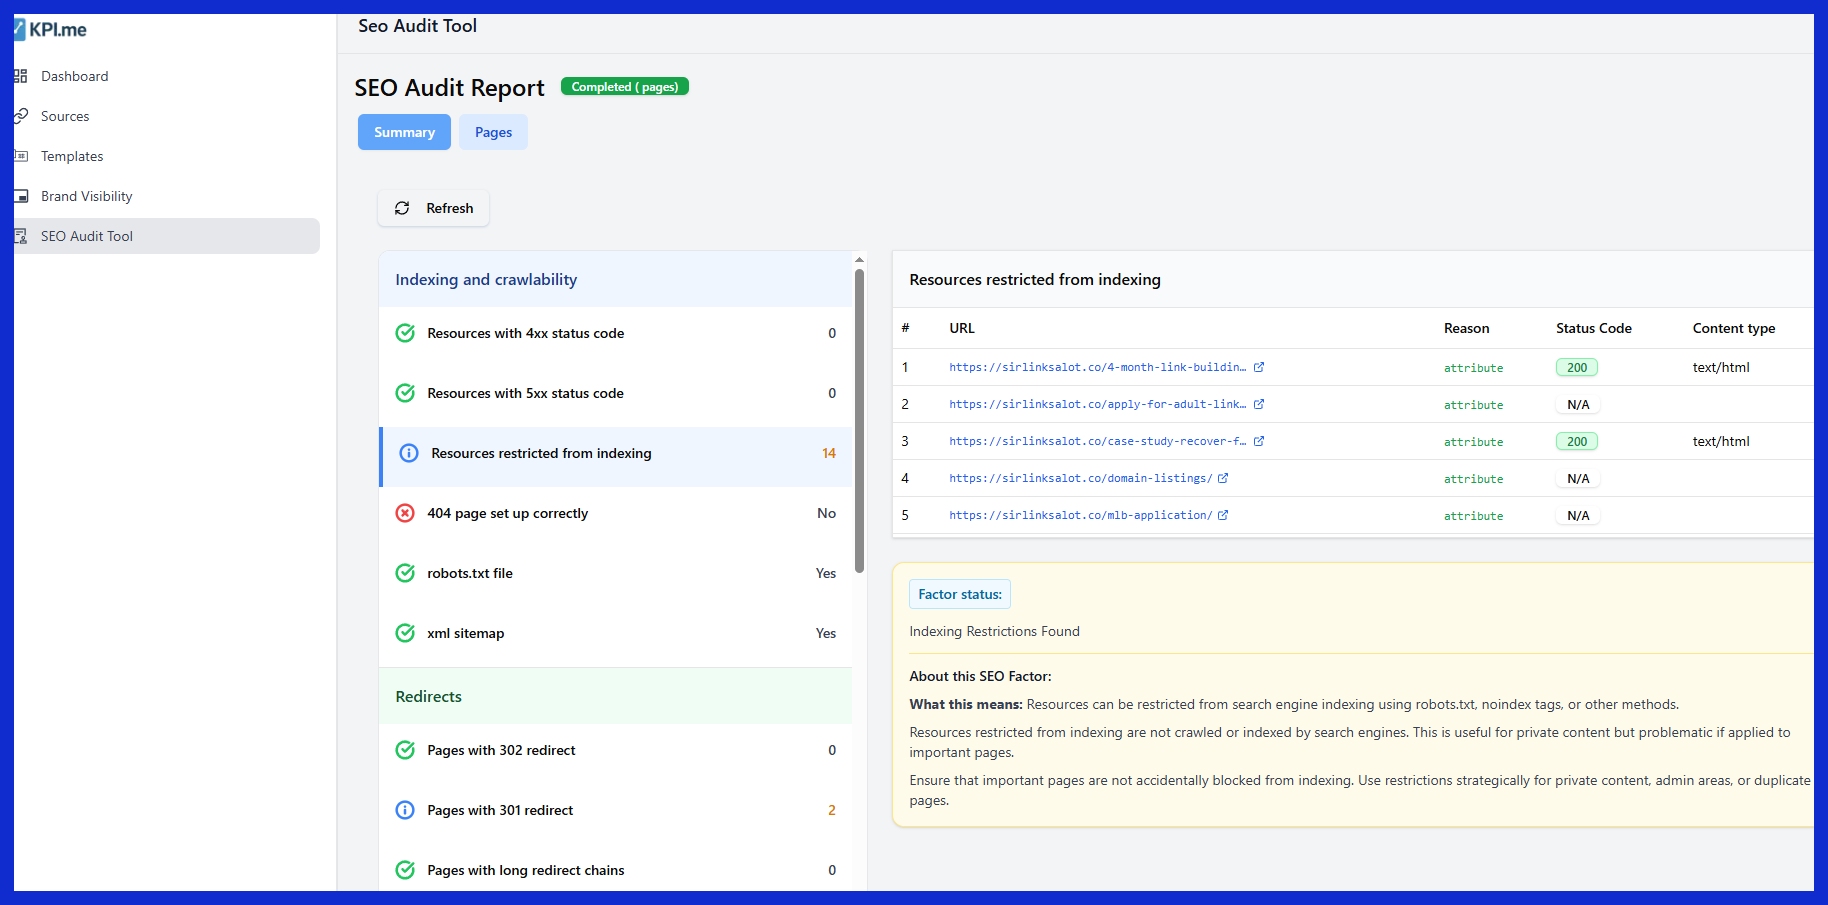
Sales reports provide an excellent view on trends, successes, and shortfalls. They slice through guesswork and reveal what drives or impedes sales. Good sales reports are about more than just the numbers. They reveal trends, emphasize important deals, and indicate opportunities for expansion. Teams can identify what works, abandon what doesn’t, and stay aligned with data-driven momentum. Convenient tools such as KPI.me make these reports quick and straightforward. No one has to sift through ancient folders or await status reports. Try something new to track sales, share updates, and make smart moves. Begin with something easy, like sales reports, and watch what shifts the following month. Announce sales reports for obvious sales victories. Try it and watch the change.
Frequently Asked Questions
What is the main purpose of a sales report?
Sales reports, such as monthly sales reports and sales pipeline reports, monitor sales over a defined period, assisting companies in tracking trends and making decisions.
What should be included in a sales report?
Key pieces include total sales, sales by product or service, customer information, and sales trends, along with a sales performance comparison to targets. Figures such as charts assist in making the conclusions clear.
What are common types of sales reports?
Typical examples include daily sales report templates, weekly sales report summaries, and monthly sales reports focusing on sales performance.
How do I create an effective sales report?
Use concrete data, brief explanations, and supporting visuals in your sales report. Concentrate on key sales metrics related to business objectives and refresh your sales reporting process often for optimal effect.
Why is it important to go beyond the numbers in sales reports?
Sales reports, including monthly sales reports and sales performance metrics, are not just numbers; they provide insights, trends, and context that help explain results and guide better business strategies.
What are common mistakes when preparing sales reports?
Mistakes in sales reporting include failing to update data, employing ambiguous graphics, and concentrating exclusively on raw sales metrics. Don’t overlook context or disregard KPIs.
How often should sales reports be updated?
Sales reporting should be refreshed on a regular basis, whether daily, weekly, or monthly, depending on business needs and decision timelines for effective sales performance.